 Bilal Siddiqui

Key takeaways
Separate Distinct Share Metrics: Defined-market share, Search Share of Voice, Search Term Impression Share, click share, and conversion share are not interchangeable; substituting them leads to misdiagnosed problems and misallocated spend.
Isolate Funnel Gaps Before Taking Action: Narrow competitive losses down through six distinct layers—demand, visibility, click capture, purchase capture, retail explanation, and economics—so you avoid mistakes like buying paid traffic for an ASIN that fails to convert.
Define Granular, Substitutable Competitor Sets: Base competitor tracking on 3–5 direct substitutable ASINs and query-specific performers surfaced by Query Detail, rather than generic category leaders from search result screenshots.
Map Specific Competitive Questions to Native Reports:
Search Query Performance & Query Detail: Uncovers where in the search results funnel your brand loses ground and compares your ASIN against the top 10 performers for a query.
Amazon Search Terms Report: Measures click share against conversion share to reveal whether a product underperforms before or after the click.
Product Opportunity Explorer: Evaluates niche-level demand, structural concentration, and unmet customer needs.
Search Term Impression Share: Evaluates paid advertising share and rank, which reflects ad participation rather than organic presence or overall market dominance.
Ground Retail Audits in Observable, Normalized Data: Compare price normalized by unit or pack size, evaluate review and return themes for recurring customer pain points, and treat competitor creative choices as testable hypotheses rather than rules to copy.
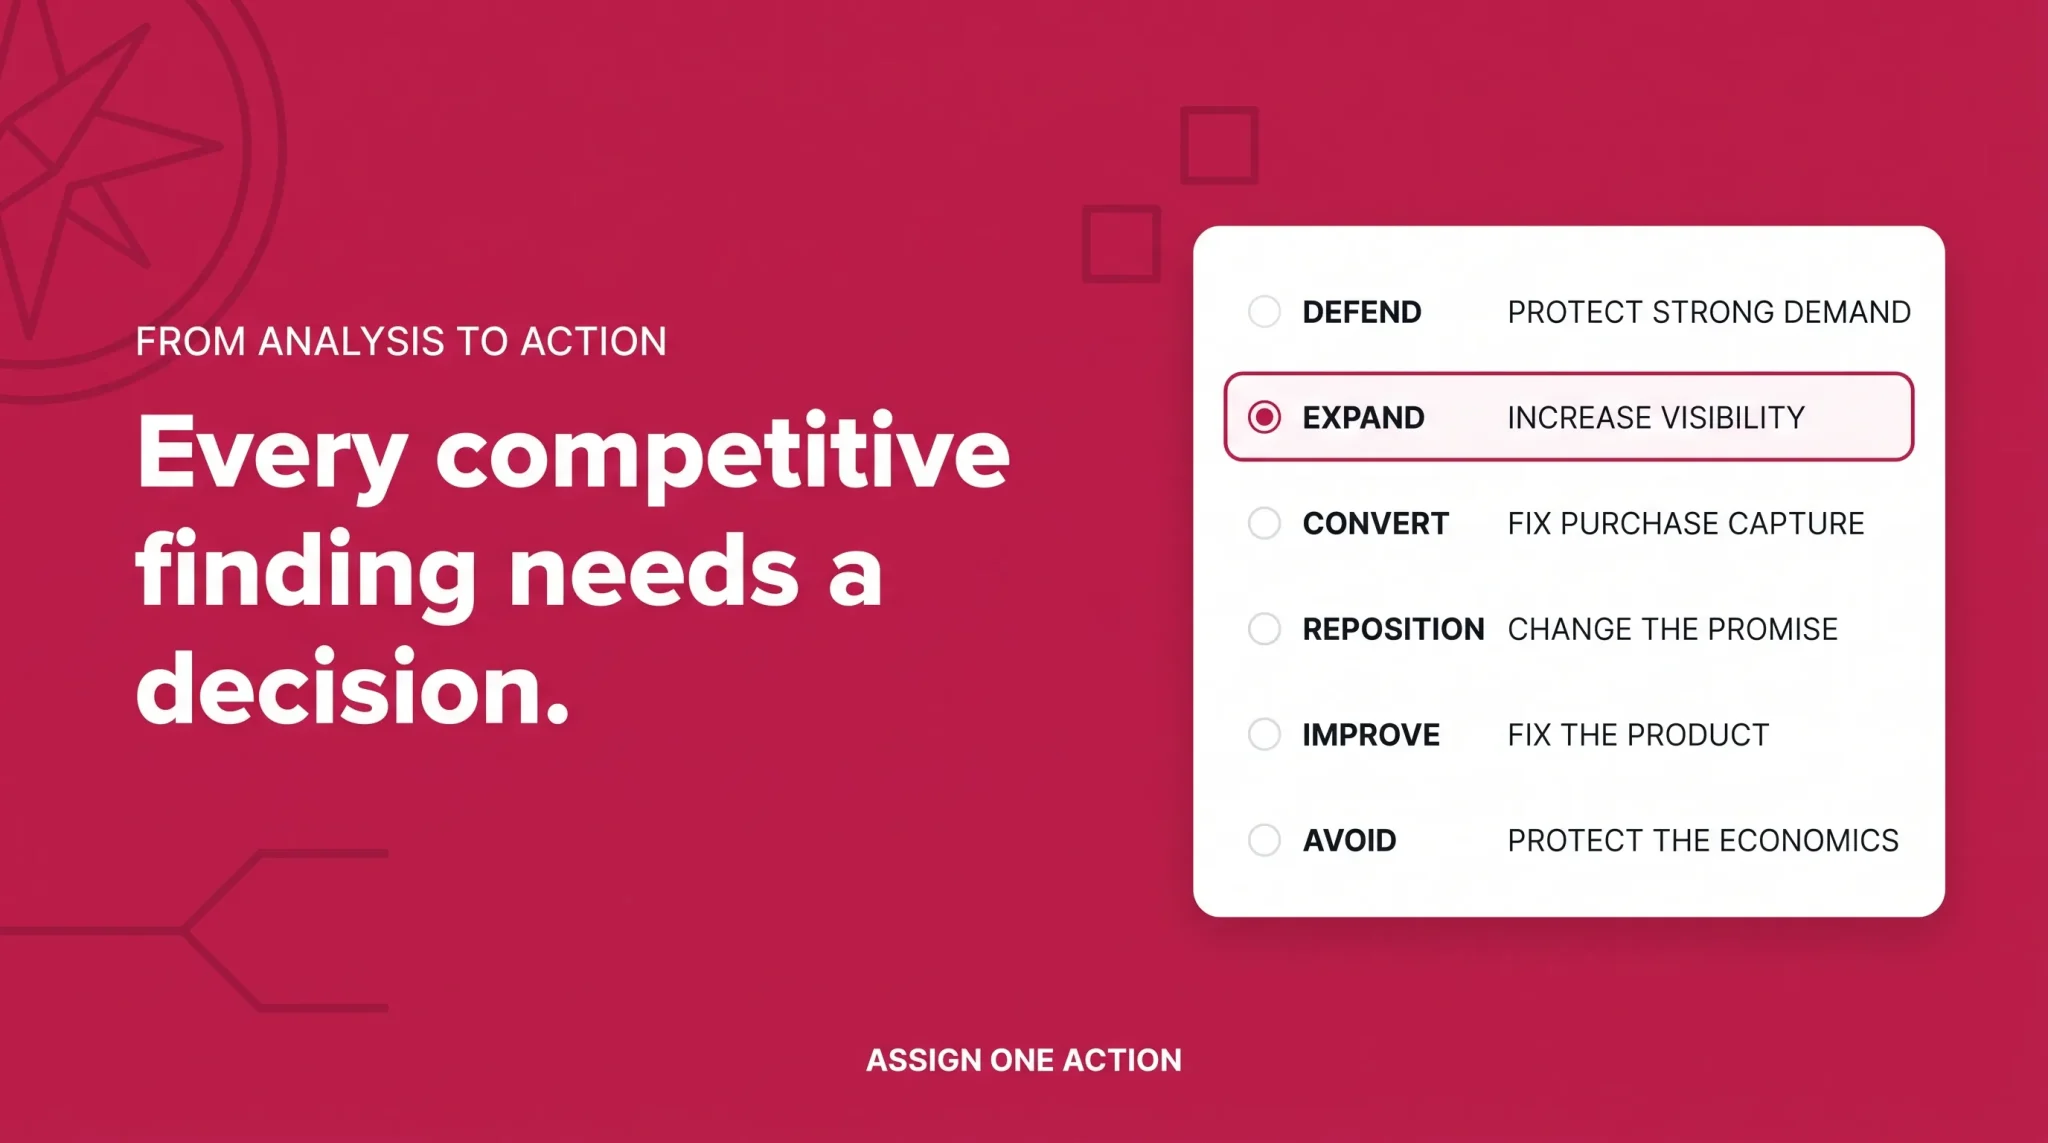
Map Findings to One of Six Strategic Actions: Analysis should culminate in a concrete decision—Defend (protect strong share), Expand (scale traffic where conversion works), Convert (fix post-click friction), Reposition (realign product promise), Improve (address core product defects), or Avoid (step away from uneconomic demand).
Maintain a Tiered Cadence: Conduct weekly or biweekly scans on priority queries, monthly deep dives on competitor creative and review trends, and quarterly reviews on broad market definitions.
A brand manager says the team lost market share last quarter. Ask what that means and you usually get one of six different answers.
Sometimes it means ad impression share fell. Sometimes a competitor now appears above them in search results. Sometimes category rank slipped. Sometimes a spreadsheet compared their sales against a number nobody can source. These are not the same measurement, they do not have the same causes, and the fixes for each are different.
That confusion is what makes most Amazon competitor research unproductive. The team gathers screenshots, price checks, and a keyword list, then produces a document describing competitors without identifying where the brand is actually losing. This guide covers how to separate those measurements, which Amazon-native reports answer which competitive question, and how to turn the findings into a decision.
First Define What You Are Trying to Win
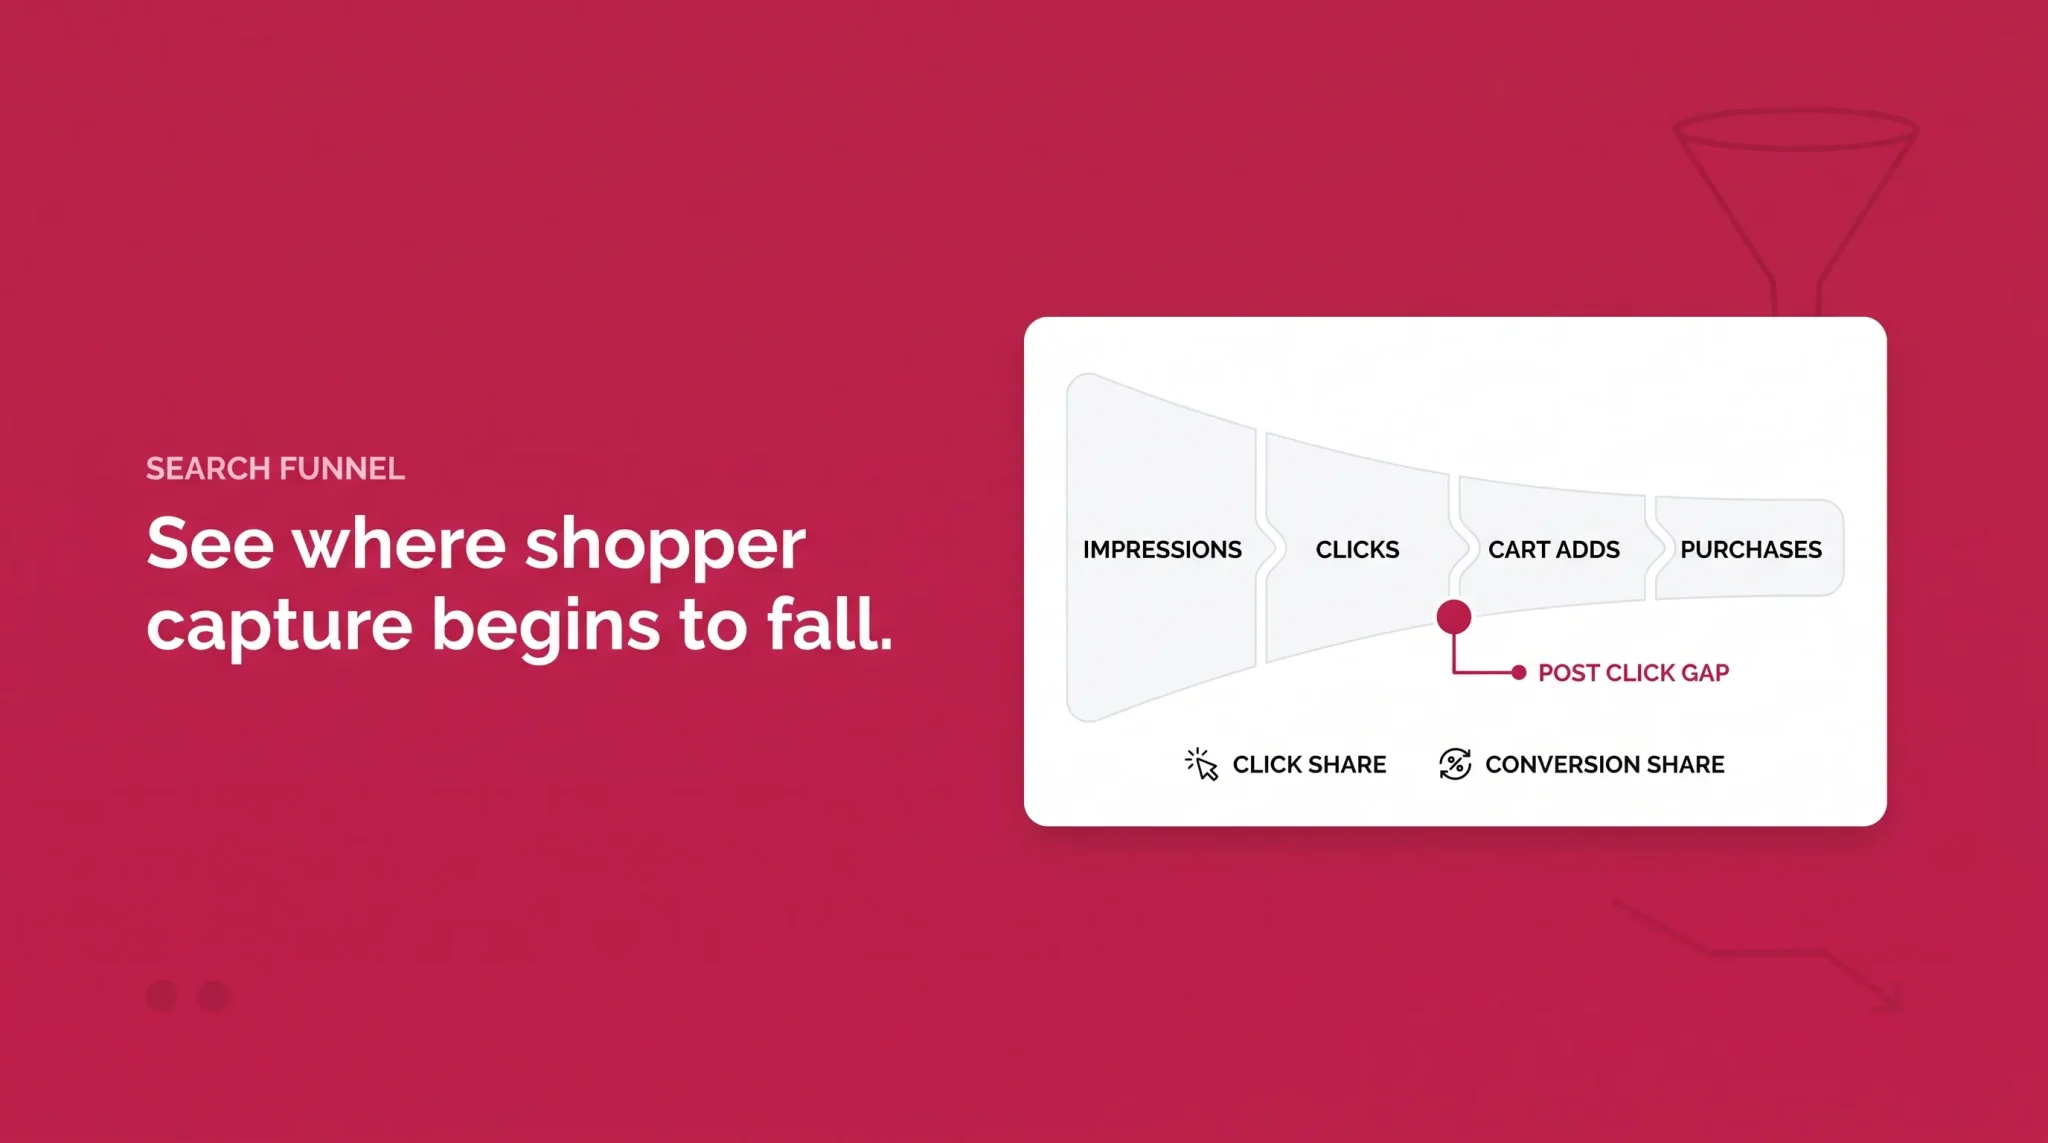
The useful question is narrow: against which products, for which shopper need, at which stage of the Amazon search and purchase funnel, are we actually losing?
That question has six layers, each with its own evidence. Demand asks whether the shopper need is worth competing for. Visibility asks whether the brand participates in the relevant search opportunity. Click capture asks whether shoppers choose your product when they see the options. Purchase capture asks whether the click becomes a purchase. Retail explanation asks what observable difference could account for a gap. Economics asks whether closing that gap produces worthwhile contribution.
Working through them in order narrows the problem at each step. A brand that skips to the retail layer rewrites its listing when the real issue was that it barely appeared for the query. A brand that skips to visibility buys more traffic for a product already failing to convert what it had.
The output is not a ranked list of competitors. It is an answer to which gap is worth closing.
Market Share, Share of Voice, and Impression Share Are Not the Same Thing
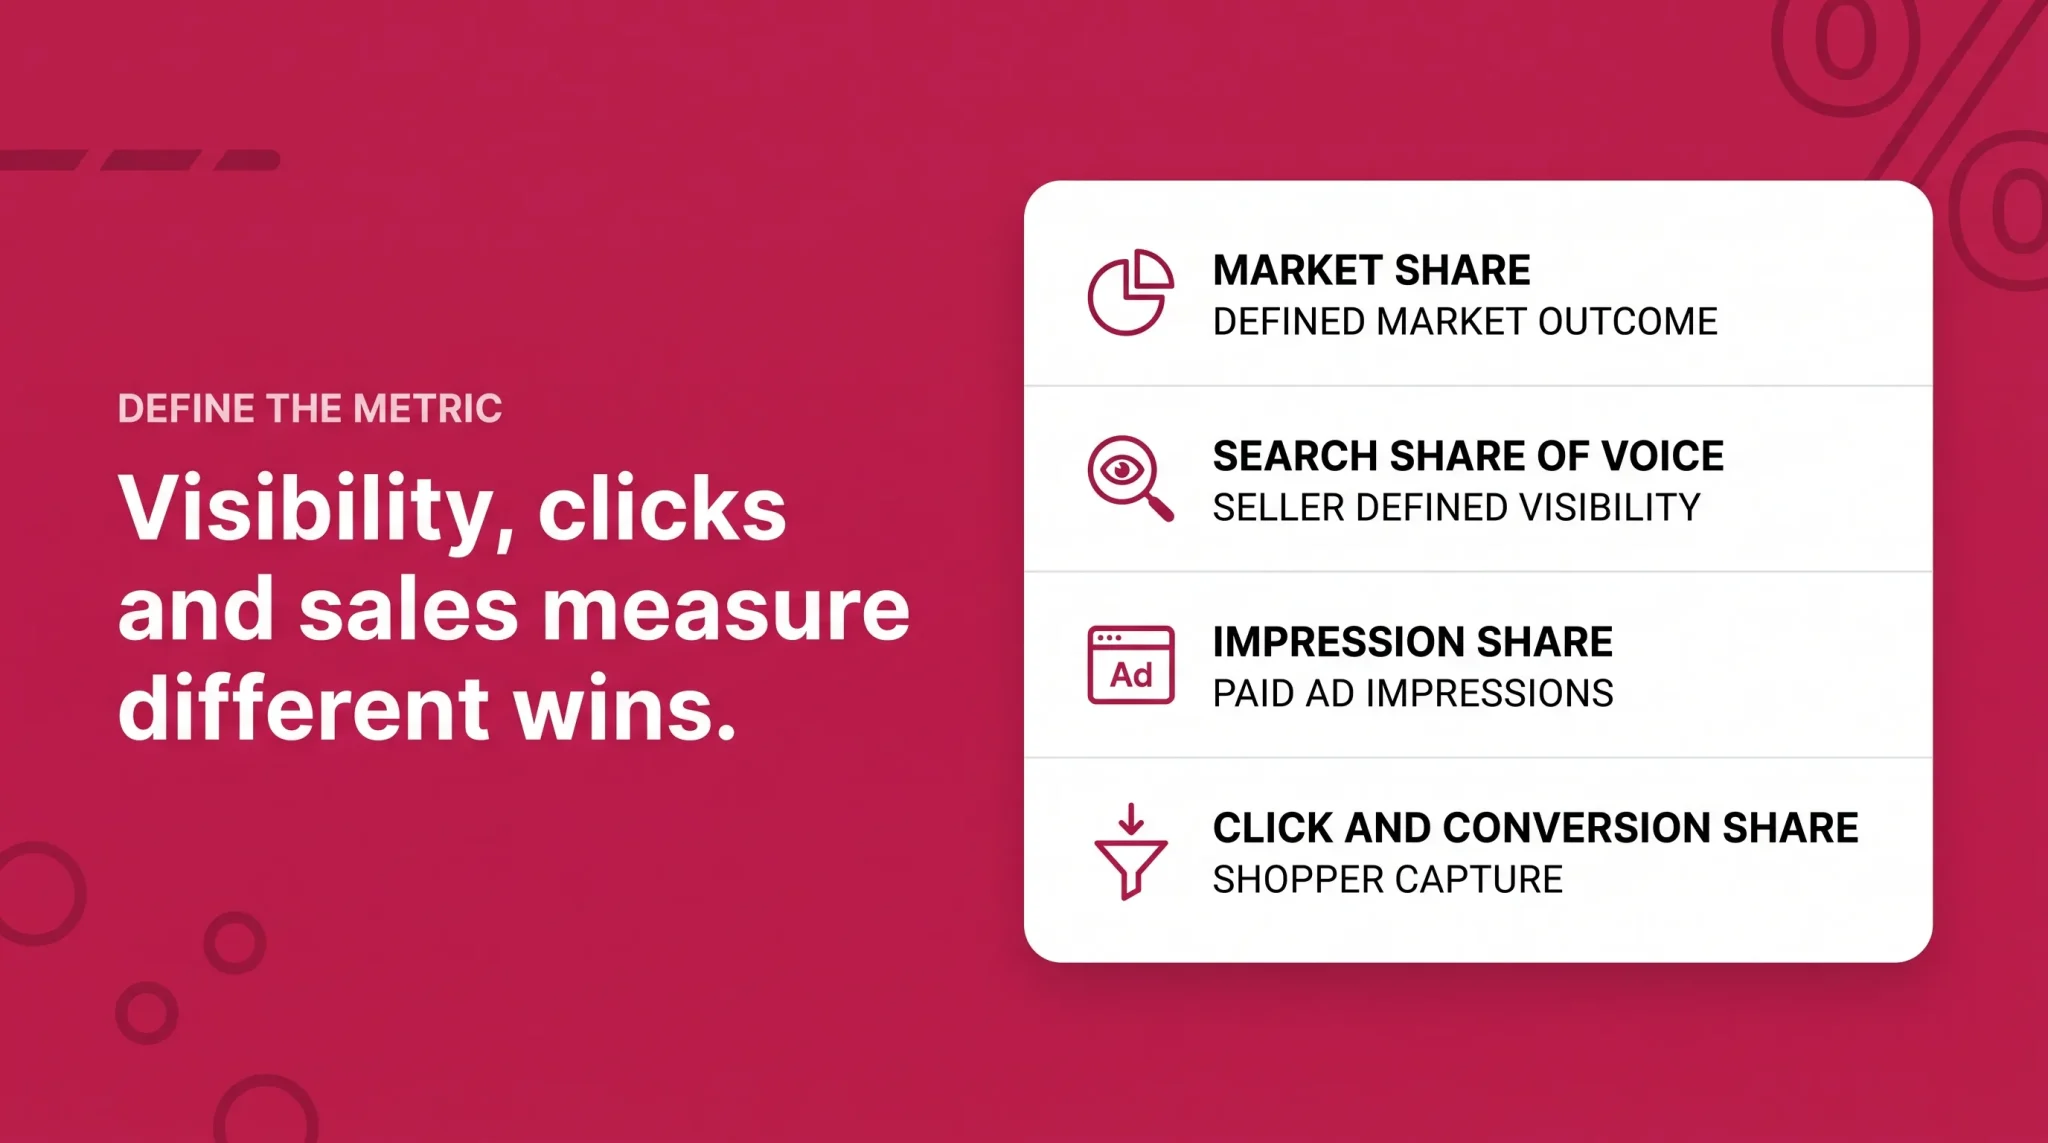
These terms get used interchangeably, and the substitution causes real strategic errors.
Defined-market share is the percentage of a clearly bounded market outcome your brand captures. It requires a valid numerator and denominator, both measuring the same thing over the same period in the same marketplace.
Search Share of Voice is a practical umbrella concept for how much visibility a brand captures across a clearly defined Amazon search set. Amazon does not publish one universal marketplace-wide report combining organic and paid visibility under that name. If your team builds its own visibility percentage from tracked results, that is a seller-defined Share of Voice measure, useful for internal trending but not an Amazon metric.
Search Term Impression Share is an official Amazon Ads metric covering paid advertising impressions for a specific search term. Not organic visibility, not total search visibility.
Click share and conversion share are separate Amazon-reported metrics scoped to a specific search term, covering shopper clicks and purchases respectively.
None of these four is market share. Category sales rank is a fifth thing again, and retail competitiveness, meaning price, offer, trust, and content, is the explanation layer rather than a share metric at all.
Tool or report | Best competitive question | Scope | Main limitation |
|---|---|---|---|
Search Query Performance | Which queries matter, and where in the funnel do I lose ground? | Queries associated with your brand or ASINs, Brand Registry required | Not pure organic. Its search results scope includes organic and Sponsored Products activity and excludes certain search page widgets |
Query Detail | Which ASINs perform strongly across this query's funnel? | Top 10 ASINs for a query, compared against your ASIN | Performance comparison, not competitor private financials |
Amazon Search Terms report | Which products capture clicks and purchases after this search? | Top three clicked products per term, with click and conversion share | Term-specific and top-three only, not total category market share |
Product Opportunity Explorer | Is this space concentrated, fragmented, or showing unmet demand? | Niches built from search and purchase relationships | Decision support, not a forecast or competitor economics |
Search Term Impression Share | How much of the paid impression opportunity did we capture? | Account-wide advertising impressions per search term | Paid advertising visibility only |
ASIN Benchmarking | Is my ASIN performing above or below comparable products? | Your ASIN against anonymized similar ASINs | Anonymous benchmarks, not named competitor reporting |
Public detail page | What can a shopper actually see and compare? | Price, offer, ratings, reviews, content, availability | Observable snapshot only, and all of it changes |
Build the Right Competitor Set
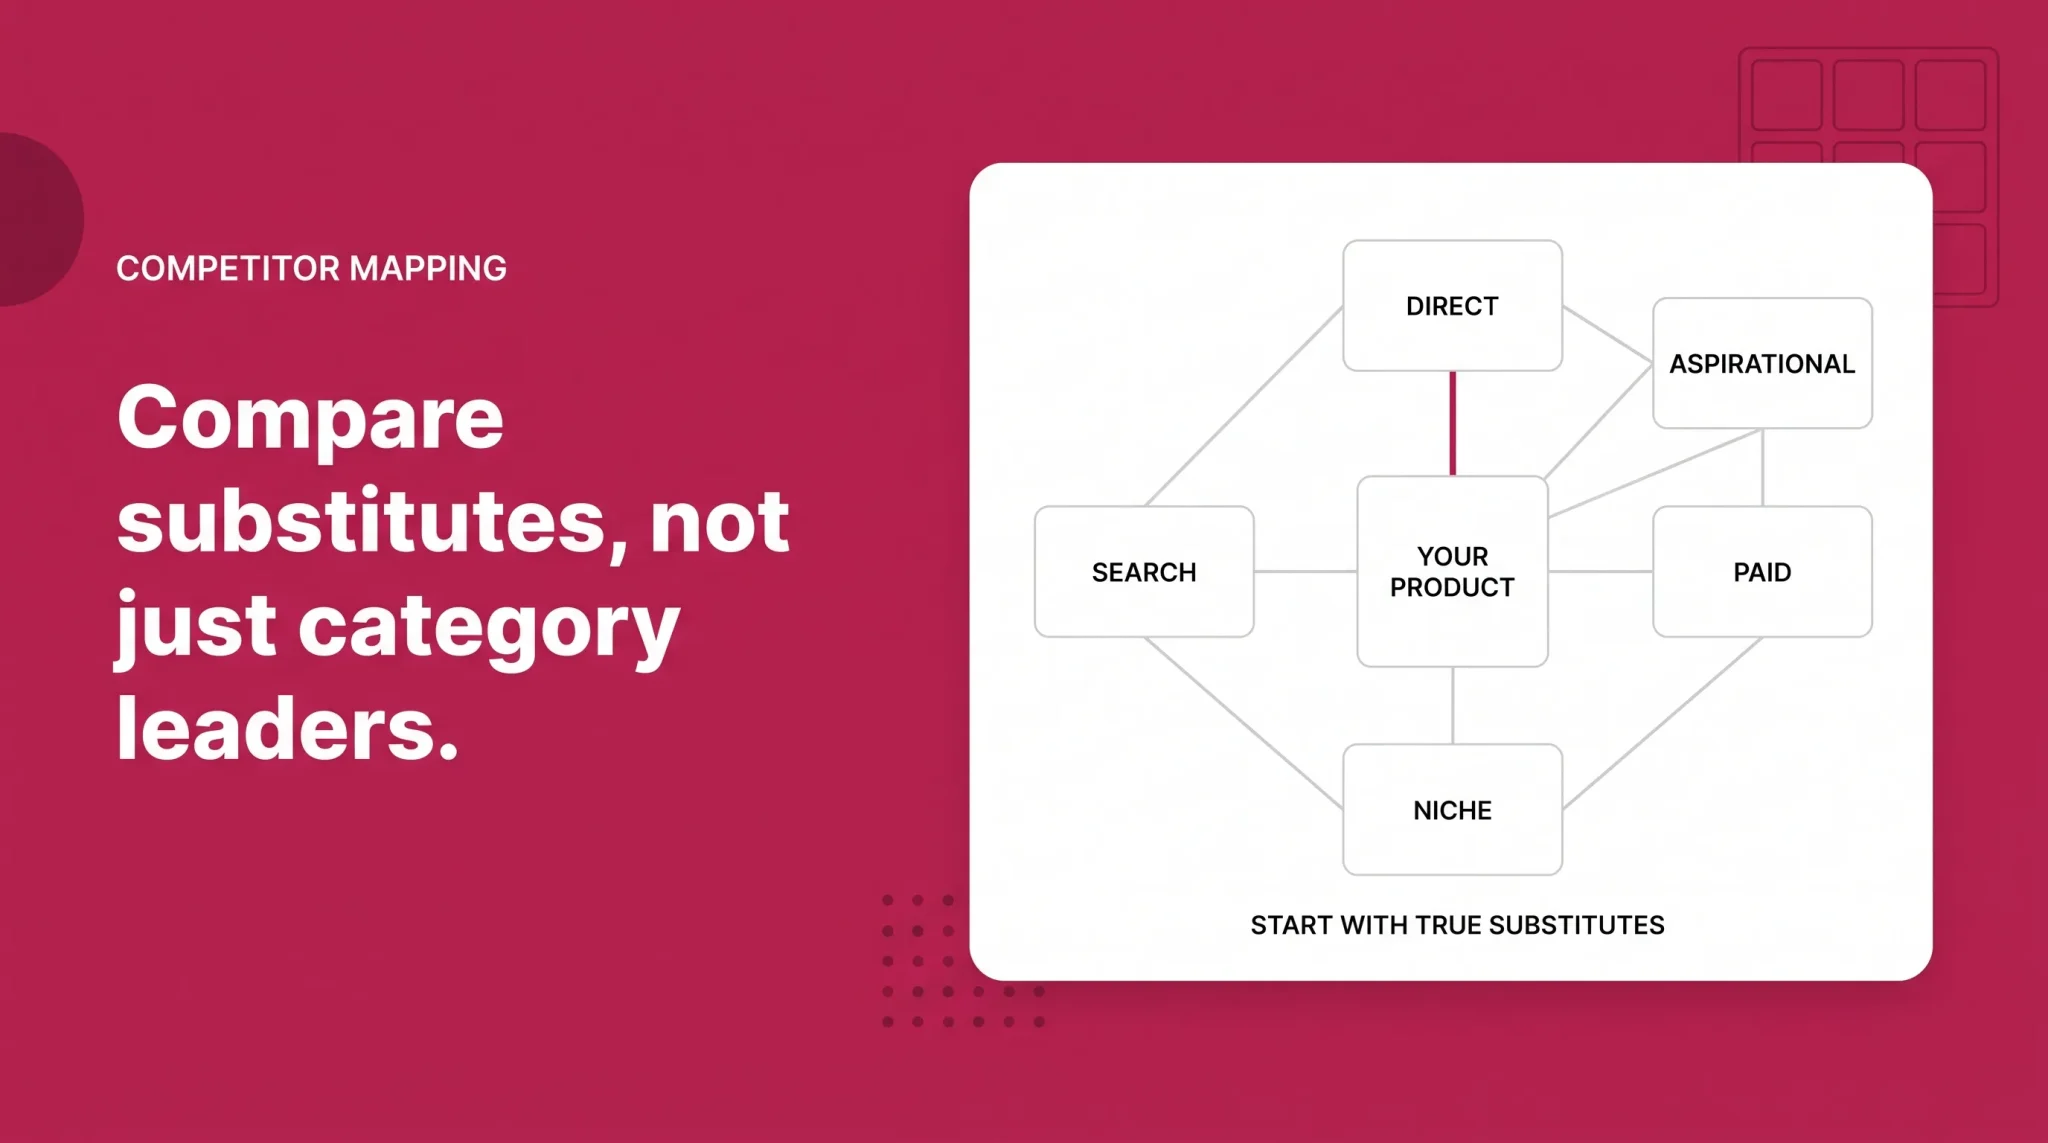
Most competitor lists come from a single search results screenshot, which produces category leaders rather than substitutes.
Five groups are worth keeping separate. Direct competitors are likely substitutes for the same shopper need, sharing a primary use case, comparable format, similar price band, similar quantity, and similar delivery expectation. Search competitors are ASINs performing strongly on a specific query. Paid competitors are advertisers bidding into the same sponsored impressions, visible only in aggregate. Niche competitors are products grouped into the same Product Opportunity Explorer niche. Aspirational benchmarks are strong performers worth learning from that may not be substitutes at all.
A direct retail competitor and a search query competitor are frequently not the same product. A travel mug may face one set of ASINs on "travel coffee mug" and a different set on "insulated tumbler with straw." The shopper need behind each query differs, and so does the competitive field.
Three to five direct substitutable ASINs is a useful starting set, treated as guidance rather than a rule, with query-specific competitors added as Query Detail surfaces them. A tight, genuinely substitutable set produces better decisions than a long list of unrelated category leaders.
Define the Market Before You Calculate Share
Market share is a ratio, and a ratio is only as good as its denominator.
Define the market scope first. It might be one search term, a basket of important search terms, a clearly defined niche, a group of substitutable products, a category or subcategory where reliable totals genuinely exist, a specific price tier, or a specific shopper use case. The denominator has to match the question.
When both numbers are reliable, the calculation is straightforward.
Defined-market sales share = your sales within the defined market ÷ total known sales within the same defined market × 100
This is only useful when numerator and denominator represent the same market, marketplace, period, and outcome. Amazon Seller Central does not universally provide a complete sales denominator for every category, and dividing your Amazon sales by total Amazon ecommerce sales is not a product-level market share calculation. Neither is inferring your category position from published statistics about Amazon's share of retail.
If the denominator is not reliable, do not manufacture a figure. Use what Amazon actually scopes and reports: click share, conversion share, Search Term Impression Share, query-level funnel performance, and niche concentration. A well-scoped share metric beats an invented one.
Search Query Performance and Query Detail
Search Query Performance is the closest thing Amazon gives brand owners to a query-level competitive lens. It requires a Professional selling account and a Brand Representative role for a brand enrolled in Amazon Brand Registry, and sits under Brands, then Brand Analytics.
The dashboard surfaces query volume, impressions, clicks, cart adds, and purchases for queries associated with your brand, along with your brand's performance relative to overall activity on those queries. That funnel structure is the point. It tells you not just that a query matters, but at which stage you lose ground on it.
One scope detail matters more than most sellers realize. Search Query Performance is not an organic-only report. Its search results metrics include activity originating from the search results page across both organic results and Sponsored Products, while excluding certain search page widgets such as Top Rated and New Arrivals. The accurate framing is that it measures how a brand or ASIN participates in the Amazon search results funnel for its associated queries, under Amazon's defined search scope. Calling it organic Share of Voice, or treating it as complete marketplace visibility, misreads what the numbers cover.
Query Detail is where the competitive value concentrates. For a selected search query, Amazon shows the top 10 ASINs and compares them against your selected ASIN. Amazon selects those top performers using a Query ASIN score combining search funnel signals including impressions, clicks, cart adds, and purchases.
That changes how competitor sets get built. Instead of guessing who your competitors are from one screenshot taken on one day from one location, Query Detail shows which ASINs Amazon identifies as strong performers across that query's funnel, with their prices and detail pages available to compare against your own.
What it does not expose is competitor revenue, profit, advertising spend, private conversion data, or account information. For full dashboard navigation and metric definitions, use the Amazon Brand Analytics guide.
Click Share and Conversion Share in the Amazon Search Terms Report
The Amazon Search Terms report, which some Brand Analytics content surfaces as Top Search Terms, answers a different question: for a given search term across the whole store, which products actually capture shopper attention and purchases?
It provides popular search terms, a Search Frequency Rank, the top three clicked products for each term, and click share and conversion share for each of those products. You can search by term or by product, and the report refreshes weekly.
Click share is, for a particular search term, the percentage of aggregate customer clicks captured by a product relative to all aggregate product clicks following that term. It is not sales share, category share, a conversion rate, or impression share.
Conversion share is based on purchases of the product after that search term relative to aggregate purchases of any product after the same term. In plain terms it is purchase capture, though the official name is worth keeping. It is not total category market share, not the product's own conversion rate, and not an account-level sales share.
These two move independently. Conversion share can run higher than click share, which usually means the product converts the attention it receives more efficiently than the field around it. The reverse pattern, healthy click share with weak conversion share, is one of the most actionable findings available, because it isolates the problem to what happens after the click.
Search Frequency Rank indicates how popular a search term is relative to other Amazon search terms during the selected period. It is not search volume, not Best Sellers Rank, not organic keyword rank, and not an advertising rank. Deeper keyword work belongs in the Amazon SEO framework.
Product Opportunity Explorer for Niche Competition
Product Opportunity Explorer is available to Professional sellers from the Seller Central main menu under Growth. It organizes products and search terms into niches representing specific customer needs, built by grouping search terms according to the products customers view or purchase after searching. You can browse by category, keyword, or ASIN.
For competitive work its value is structural context rather than individual competitor detail. It shows demand, competition, search, review, return, and product context for a space, which answers whether that space is concentrated around a few dominant products, fragmented across many, or showing a recurring unmet customer need nobody has addressed well.
Amazon is explicit that the tool is decision support rather than a guaranteed forecast, and should not substitute for your own judgment about where to invest. It does not report competitor revenue, profit, or exact economics. Product discovery and validation belong in the product research guide.
Paid Visibility with Search Term Impression Share
Search Term Impression Share measures your account's share of advertising impressions for a particular search term relative to other advertisers generating impressions for that term within the supported Amazon Ads context.
Amazon's own example makes the scope concrete: a Sponsored Products impression share of 20 percent for a search term on a given date means your ads won 20 percent of all Sponsored Products ad impressions for that term that day. The companion metric, Search Term Impression Rank, is the numeric rank of your impression share compared with other advertisers on the same term. A rank of 3 means you received the third most Sponsored Products impressions for it.
The report supports summary and daily reporting with a 90 day lookback window as of August 2026. Confirm the current window and report location in the advertising console, since Amazon Ads reporting is currently migrating toward unified reporting.
The question it answers is precise: how much of the available sponsored impression opportunity did our ads capture on this search term? It does not answer organic visibility, total search visibility, category sales share, click share, conversion share, profitability, competitor identity, or competitor ad spend.
Whether to act on a low impression share is a separate judgment. Low share can be entirely rational when the economics are weak, the query is only loosely relevant, organic participation is already sufficient, competitors are bidding past what the term is worth, or the term is not strategically important. Bidding and budget decisions belong in the advertising workflow rather than here.
Paid Impression Share Versus Broader Search Visibility
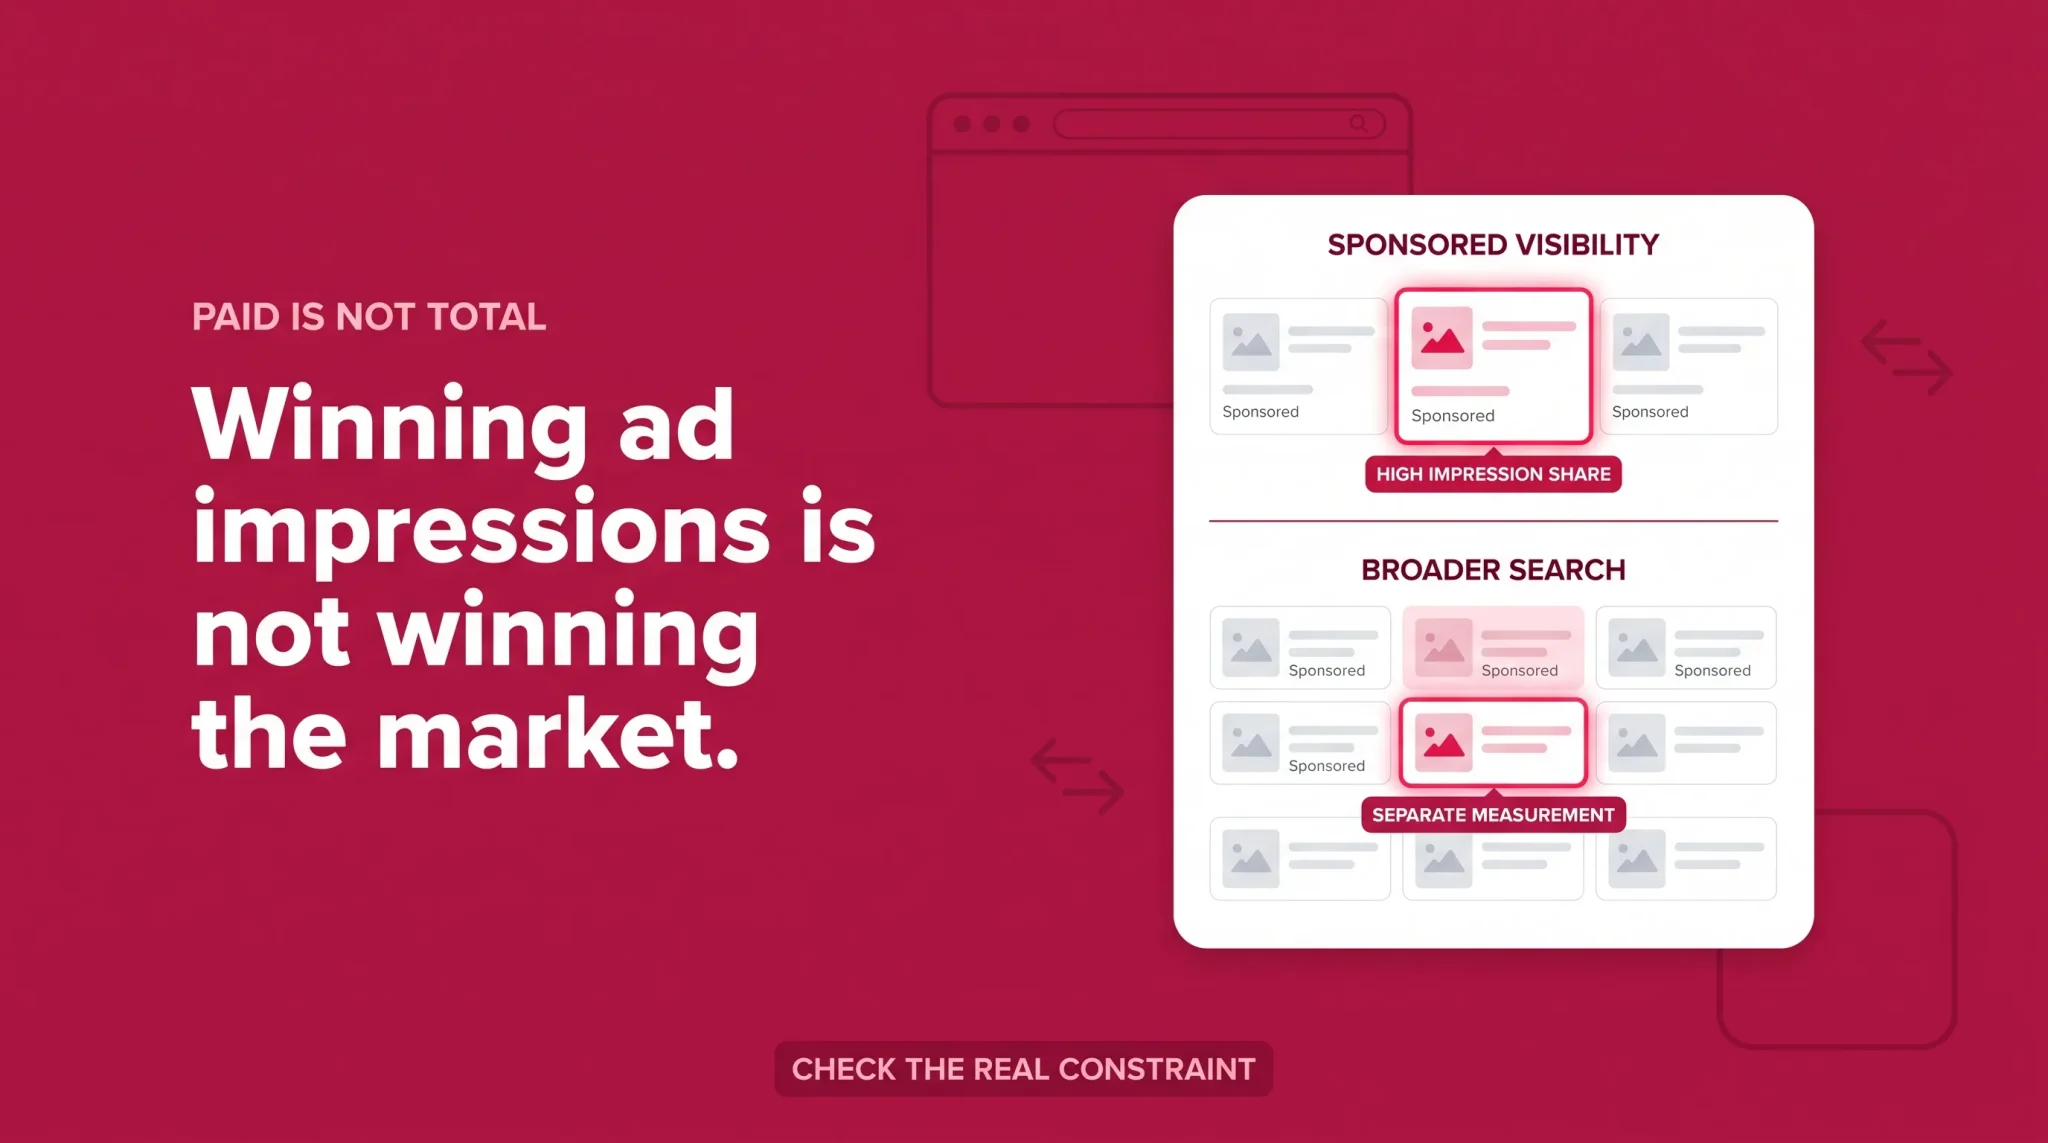
This deserves stating on its own, because conflating the two is the most common error in Amazon competitive reporting.
A brand can hold high Search Term Impression Share and still have weak organic search presence. It can have strong search presence and low paid impression share. It can generate strong impressions and lose on click share. It can win click share and lose on conversion share. And it can lead on every visibility measure while running a negative contribution margin.
High impression share does not prove the brand is winning the market. It proves the brand is winning sponsored impressions on that term. Treating the first as evidence of the second leads teams to spend against a metric that is not the constraint.
The Retail Competitor Audit
Once the data tells you which layer is weak, the detail page tells you what a shopper can actually see. Run the same framework across every direct competitor so the comparison holds.
Product. Use case, format, material, dimensions, quantity, features, included accessories, and any stated certifications.
Offer. Current price, active promotion, pack size, delivery promise, availability, and the variation choices available.
Trust. Star rating, review count, review recency, the praise that repeats, and the complaints that repeat.
Creative. Main image, secondary images, video, A+ Content, and any visible comparison modules.
Positioning. The main promise, target user, use case emphasized, price tier, and stated differentiation.
Record only what is directly observable. A detail page does not reveal unit economics, margin, inventory position, or business strategy, and inferring those from what you can see produces confident conclusions built on nothing.
On price, the instruction is not to beat the lowest competitor. Normalize first, by pack size, quantity, volume, unit, or usable serving, so the products are comparable. Then record the observation date, because prices and promotions change and a snapshot treated as a permanent benchmark will mislead you a month later. The strategic question is whether your price makes sense relative to the value a shopper can see on the page.
Review and Return Gap Analysis
Reviews are the most underused competitive evidence available, because they describe the gap between what a product promises and what customers experienced.
Read across the competitive set for recurring themes rather than individual complaints. Repeated praise tells you what the category has taught shoppers to expect. Recurring durability issues, sizing problems, compatibility confusion, packaging complaints, unclear instructions, missing features, and quality inconsistency all point at either an opportunity or a risk you share. Customers also reveal use cases the category has not addressed and improvements they wish existed. Where Amazon-native aggregated review and return insights are available, they support the same analysis at scale.
What reviews cannot do is estimate sales. Review count does not convert to units through any reliable ratio, review velocity is not a sales signal, a high review count does not prove superior quality, and a low review count does not prove low competition.
Content and Creative Benchmarking
Creative comparison should produce hypotheses, not a copy list.
The useful observations are specific. A competitor visually proves an attribute your listing only states in text. A competitor communicates dimensions or compatibility more clearly than you do. Every product in the set fails to answer one concern that keeps appearing in reviews. One product's video resolves an uncertainty static images cannot. A competitor's A+ Content emphasizes a use case that customer behavior suggests shoppers value.
Each becomes a testable hypothesis for the listing or conversion workflow. None is an instruction to replicate whatever the category leader does, since the leader's choices may be working despite their creative rather than because of it.
The Competitive Gap Matrix
Competitive layer | Amazon-native evidence | What the gap may mean | Next question |
|---|---|---|---|
Demand | Query volume, niche context | The need may be too small or seasonal to prioritize | Is this shopper need worth competing for? |
Search visibility | Search Query Performance impressions | The brand is not participating in the search opportunity | Is the product relevant to the query, and eligible to appear? |
Paid impression share | Search Term Impression Share and Rank | Paid participation is limited relative to other advertisers | Is more paid participation economically justified here? |
Click share | Amazon Search Terms report | Shoppers see the product and choose another | What differs in image, price, rating, or title at the moment of choice? |
Conversion share | Amazon Search Terms report | The click arrives but the purchase goes elsewhere | What on the detail page or in the offer fails to close? |
Price and offer | Detail page, Query Detail comparison | Value perception may be misaligned with the field | Does the price make sense for what the shopper can see? |
Reviews and trust | Detail page, review themes | Trust evidence is thinner than the set | What objection do reviews keep raising? |
Product | Review and return themes | A genuine product gap may exist | Is this fixable through content, or does the product need to change? |
Content | Detail page, A+ comparison | The page may under-communicate rather than under-promise | What do competitors prove that we only claim? |
Availability | Detail page, offer status | Demand is being met by someone else during gaps | Is supply reliable enough to hold the position? |
Three Competitive Situations
A visibility gap. The brand converts adequately when traffic arrives but participates weakly on several strategically important non-branded queries. Check whether the queries are genuinely relevant, review Search Query Performance for those terms, use Query Detail to see which ASINs perform across them, check paid impression share on contested ones, and assess whether the queries are economically worth pursuing. Rewriting the listing first would be fixing a layer that is not broken.
A click gap. The product participates in the query, but competitors capture substantially more click share. Before buying more traffic, compare what a shopper sees in the results: main image, price, rating, review count, offer, title clarity, delivery promise, and the product promise. More impressions into a weak click position multiply the problem rather than solve it.
A conversion share gap. The product captures a reasonable portion of clicks and a weaker portion of purchases. That isolates the problem to what happens after the click, which means investigating value proposition, price, detail page content, reviews, delivery, features, variation structure, and trust signals. This is the most diagnostically useful gap of the three, because the shopper already chose to look.
Defend, Expand, Convert, Reposition, Improve, or Avoid
Analysis that does not end in a decision is documentation. Every finding should resolve into one of six categories.
Defend applies when the brand already performs strongly on important demand. The work is protecting that position.
Expand applies when conversion and purchase capture are healthy but visibility is too narrow. The product works; not enough people encounter it.
Convert applies when visibility and clicks exist but purchase capture is weak. Traffic is not the constraint.
Reposition applies when the product promise does not align with what shoppers in that space expect. The fix sits upstream of both traffic and content.
Improve the product applies when review and return evidence repeatedly identifies a genuine gap. No amount of listing work resolves a product problem, and scaling one multiplies it.
Avoid applies when demand exists but competing for it does not make economic sense. Deciding not to pursue a market is a legitimate output, often more valuable than a plan to fight for it.
Turning any of these into an execution plan across the account belongs in the Amazon growth strategy guide.
A Competitive Analysis Cadence
Competitive analysis fails more often from unsustainable frequency than from insufficient depth.
Weekly or biweekly, for high priority queries and ASINs only, monitor material changes in search participation, click share, conversion share, paid impression share, price, promotion, and availability. This is a scan for movement, not an analysis session.
Monthly, review the substance: whether the direct competitor set is still accurate, which query competitors have changed, emerging review themes, creative and product changes across the set, query concentration, and positioning shifts.
Quarterly, or after a major market change, reassess the foundations. Is the market definition still right? Has positioning or price tier drifted? Have significant competitors entered? Has a product gap opened? Is this market still strategically attractive?
Not every seller needs to track every competitor daily, and a process built on that assumption gets abandoned inside a month.
The Competitive Analysis Checklist
Market scope and denominator defined before any share is calculated
Three to five direct substitutable competitors selected, not category leaders by default
Priority query set defined and tied to real shopper need
Search Query Performance reviewed for those queries where eligible
Query Detail top ASINs reviewed for the highest priority queries
Amazon Search Terms click share checked where the product appears
Amazon Search Terms conversion share checked alongside click share
Search Term Impression Share checked for strategically contested paid terms
Product Opportunity Explorer used for niche concentration and unmet demand context
Competitor prices normalized by pack size or usable unit, with observation date recorded
Recurring review and return themes summarized across the set
Core product attributes compared against direct competitors
Creative and A+ differences captured as hypotheses, not instructions
Availability and delivery promise observed across the set
Visibility, click capture, and purchase capture kept separate throughout
One action category assigned per finding
Most competitive analysis stalls at the description stage, producing a thorough account of what competitors are doing without identifying which gap actually costs the brand money. If a second perspective would help, Flairox can work through it with you: defining the relevant competitive set, running query-level analysis, separating visibility gaps from click gaps and conversion gaps, benchmarking product and retail evidence against the field, analyzing review themes for genuine product signals, and prioritizing the one gap worth fixing first. Schedule a call if that would be useful.
Frequently asked questions
It is the practice of identifying which products compete for the same shopper need, then using Amazon-native reporting and observable detail page evidence to determine where your brand loses visibility, clicks, or purchases.