 Ali Sohail
Key takeaways
Track smarter, not harder: Focus on a core set of 10 metrics that cover visibility, engagement, efficiency, and profitability.
Conversion Rate, ACoS, TACoS, and Real ROAS are the most actionable metrics for optimizing and scaling campaigns.
Daily vs. weekly tracking matters: Monitor fast-changing metrics like clicks and CPC often, but give conversion and profitability metrics more time to stabilize.
Real ROAS uncovers true profitability by accounting for hidden costs beyond what Amazon shows in its dashboard.
When it comes to running Amazon ads that actually drive growth, knowing which Amazon PPC metrics to track is everything. Not just to see what's happening- but to understand why it's happening, and what to do about it.
It's exactly this kind of data-led approach that has helped us drive consistent results for brands like PerfectTed and RightCar Solutions- both of whom saw 70% and 140% increases in monthly sales, respectively, after implementing structured Amazon PPC strategies.
In this post, we break down the 10 Amazon PPC metrics to track- what they mean, how to calculate them, and how to use them to make better decisions across your ad campaigns.
Which Metrics Should You Track?
When it comes to running profitable Amazon PPC campaigns, not every number deserves your attention. But there are a few core metrics that consistently give you the insights you need to optimize performance, control spend, and scale the right campaigns.
If you're only just starting to learn Amazon Ads, we strongly recommend you read our complete guide to Amazon PPC- it will give you a proper introduction to the fundamentals of PPC, and a solid starting point for future research.
Here are the 10 Amazon PPC metrics every advertiser should be tracking:
Impressions
Clicks
Click-Through Rate (CTR)
Conversion Rate (CVR or CR)
Ad Spend
Cost-Per-Click (CPC)
Advertising Cost of Sales (ACoS)
Total Advertising Cost of Sales (TACoS)
Return on Ad Spend (ROAS)
Real Return on Ad Spend (Real ROAS)
These metrics give you visibility across the full funnel- from how often your ads are seen, to how efficiently they convert, to whether your campaigns are actually profitable once all costs are factored in.
The rest of this post breaks down what each one means, how it's calculated, and how to use it to make smarter PPC decisions.
10 Amazon PPC Metrics to Track- What They Mean and Why They Matter
1. Impressions
An impression happens every time your ad actually shows up on someone's screen while they're browsing Amazon. It doesn't mean they clicked- just that it was visible long enough to count.
Why Do Impressions Matter?
Impressions tell you how many times your ad had the chance to be seen. It's one of the first signals that your targeting is working (or not). If impressions are low, your ad probably isn't even making it into the auction or showing up on relevant pages.
Think of it as the "top of the funnel" signal: no impressions means no clicks, and no clicks means no sales.
How Are Impressions Calculated?
There's no formula here- Amazon just logs an impression when your ad renders on the screen for at least one second (for Sponsored Products and Brands).
If you're interested in learning more about the different types of Amazon Ad campaigns- Sponsored Products, Sponsored Brands, and Sponsored Display- read our complete guide on it here.
Unit for Impressions | It's just a number. |
Benchmark figure for impressions | There's no "ideal" number. But if you're getting fewer than a few hundred impressions per keyword per week, you're probably not being seen enough. That said, it totally depends on your niche, targeting type, and budget. |
How To Interpret Impressions Figures
Case 1: Impressions are low
You're likely not bidding high enough to win placements.
Your keywords might be too niche, or your ASINs aren't indexed properly.
If your product page isn't well-optimized, Amazon may just not show your ad.
Case 2: Impressions are high but you're not getting clicks
That's a different problem- usually means your ad's visible, but not compelling. Time to look at CTR.
2. Clicks
Clicks count how many times someone actually tapped or clicked on your ad. Unlike impressions, a click shows interest- it means your ad did its job well enough to get someone to your product detail page.
Why Do Clicks Matter?
Clicks are the gateway to conversions. If you're getting impressions but no clicks, your ad isn't connecting. If you are getting clicks, you're at least pulling shoppers into your listing, which is step one in making a sale. It's also one of the core metrics Amazon uses to evaluate ad performance.
How Are Clicks Calculated?
No math here- Amazon simply tracks a click each time a shopper interacts with your ad and lands on your product detail page.
Unit for clicks | It's just a number |
Benchmark figure for clicks | There's no fixed number to aim for. The higher the better. But always compare the number of clicks you're getting to the number of impressions you have on your ad (more on this in the next section). |
Note: Clicks only matter if they're qualified- 100 random clicks are worse than 10 from truly interested buyers.
How To Interpret Your Click Figures
Case 1: Clicks are low
Your ad is being seen but not convincing anyone to click. This could result from issues like: irrelevant targeting, boring headlines, weak main image, uncompetitive price.
Case 2: Clicks are high, but they're not leading to sales
That usually means your listing isn't converting. Don't blame the ad- blame the product page (and optimize it).
3. Click-Through Rate (CTR)
Click-Through Rate (CTR) measures how often people who see your ad actually click on it. It tells you how effective your ad is at capturing attention and generating interest.
Why Does Click-Through Rate Matter?
CTR gives you insight into how compelling your ad is. A low CTR means people are seeing your ad but not clicking- which usually points to issues with how relevant or attractive your ad appears. A higher CTR suggests you're targeting the right audience and your ad creatives are working.
Amazon also considers CTR when deciding whether to keep showing your ad. So a weak CTR can affect future impressions too.
How Is Click-Through Rate Calculated?
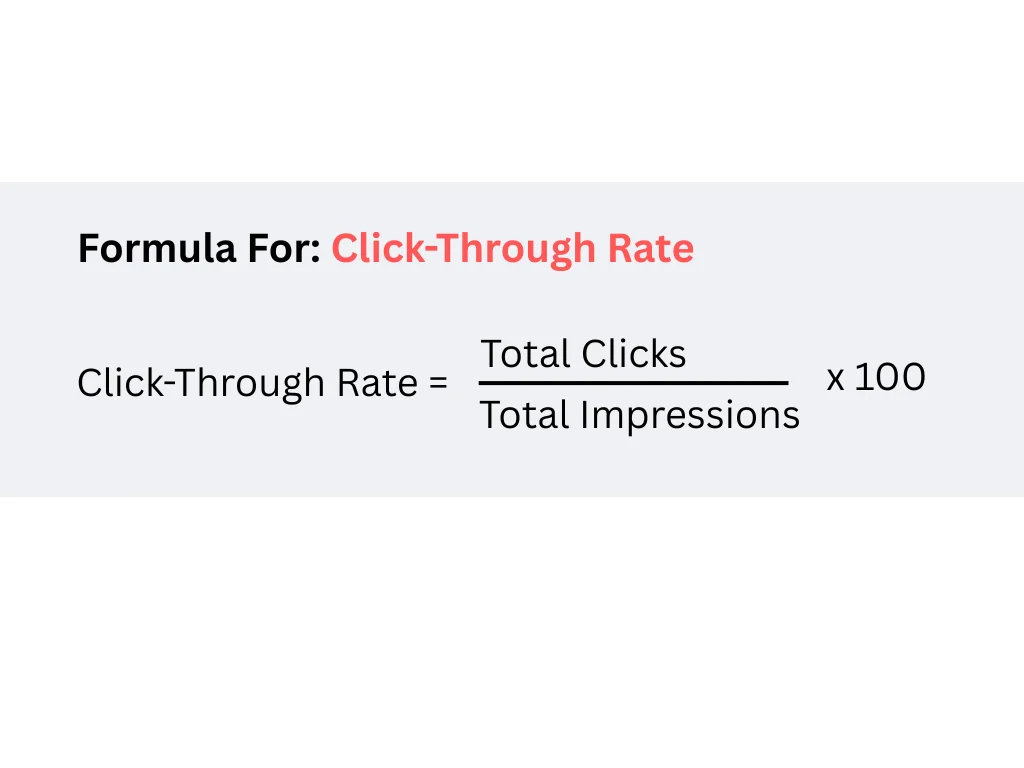
This is the formula used to determine your click-through rate:
CTR = (Clicks ÷ Impressions) × 100
Example: Let's say your ad had 2000 impressions and 40 clicks:
CTR = (40 ÷ 2000) × 100 = 2%
Unit for click-through rates | Percentage (%) |
Benchmark figures for click-through rates | 0.3% to 0.5% is average across Amazon. 1%+ is strong. But this varies a lot depending on category, ad format, and match type. Always compare CTRs within similar campaign types. |
How To Interpret Your CTR Figures
Case 1: CTR is low
Your ad is showing up but not attracting interest. This could be due to:
Unappealing main image
Weak title or copy
Irrelevant keywords or targeting
Poor placement (e.g. bottom of page)
Case 2: CTR is high but conversions are low
This might mean people are interested enough to click, but your product page isn't sealing the deal.
4. Conversion Rate (CVR or CR)
Conversion Rate tells you how many people who clicked your ad went on to buy the product. It's one of the most important indicators of how well your listing turns interest into sales.
Why Does Conversion Rate Matter?
A strong conversion rate usually means your product detail page is doing its job- good offer, compelling content, and relevant targeting. A weak conversion rate, on the other hand, could mean you're attracting the wrong shoppers or something on your page is turning them off.
Amazon also uses conversion rate in its internal ranking systems, so consistently low CVR can hurt both your ad performance and organic visibility.
How Is Conversion Rate Calculated?
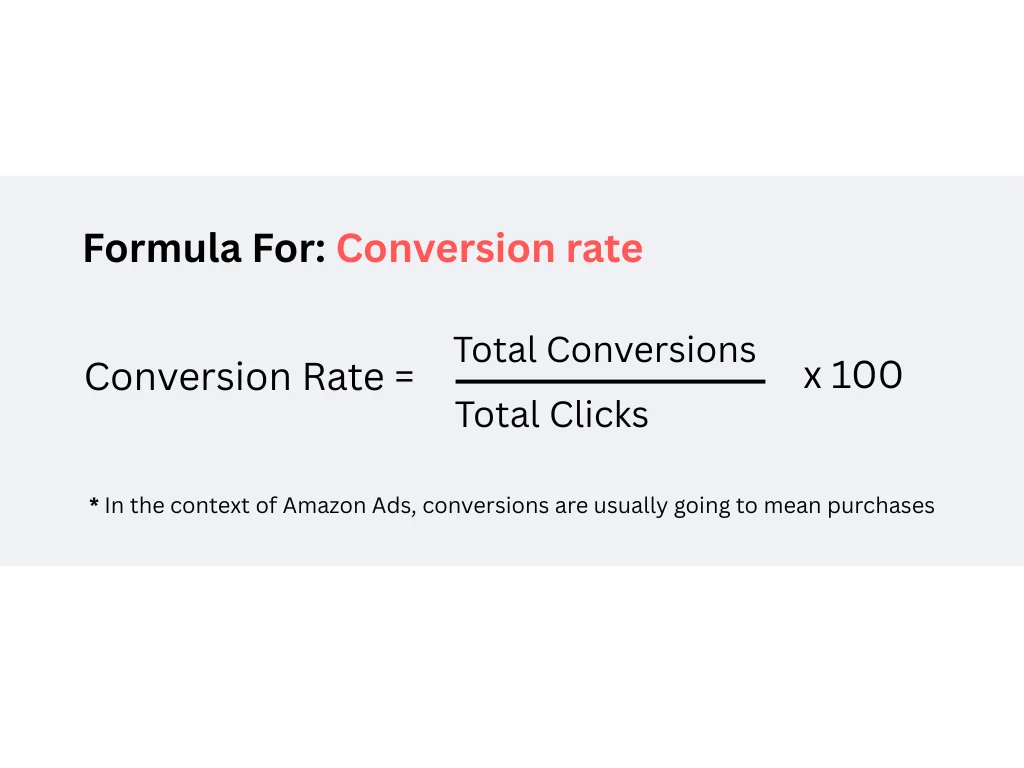
This is the general formula used to calculate conversion rate for your ads:
Conversion Rate = (Orders ÷ Clicks) × 100
Example: If your ad received 300 clicks and resulted in 21 orders:
CVR = (21 ÷ 300) × 100 = 7%
Unit for conversion rate | Percentage (%) |
Benchmark figure for CVR or CR | 10%+ is considered strong for Sponsored Products campaigns. For other campaign types the usual figure is 5%+. If your CVR is below 5%, it's worth investigating, but benchmarks vary by category and product type. |
How To Interpret Your Conversion Rate Figures
Case 1: Conversion rate is low
People are clicking, but they're not buying. Possible reasons include:
Weak product page (poor images, copy, price, or lack of reviews)
Irrelevant traffic (wrong keywords or targeting)
Product-market mismatch
Case 2: Conversion rate is high
That's a good sign. Your listing is doing its job well. In fact, you may want to:
Increase bids to get more impressions
Scale up winning keywords or ASIN targets
Use this campaign's structure as a template for others
5. Ad Spend
Ad Spend is the total amount of money you've spent on clicks in your Amazon PPC campaigns over a given time period. It's what Amazon charges you based on actual clicks- not impressions or bids alone.
Why Does Ad Spend Matter?
This is the core input to every other performance metric- your CPC, ROAS, ACoS, and TACoS all depend on how much you're spending.
Tracking ad spend helps you:
Stay within budget
Measure return on investment
Compare campaign efficiency
Prevent overspending on underperforming ads
It's not just about how much you spend, but how smartly you spend it.
How Is Ad Spend Calculated?
You don't need to perform any calculations to determine your Ad Spend- it's simply what Amazon charges you for your ads.
That said, if you know your cost per click (CPC) and the number of clicks received, you can calculate Ad Spend using this formula:
Ad Spend = CPC × Number of Clicks
Example: If your CPC is $0.80 and you got 150 clicks:
Ad Spend = $0.80 × 150 = $120
Unit for Ad Spend | Dollars ($) |
Benchmark figure for Ad Spend | There's no benchmark figure for Ad Spend- it totally depends on your budget, goals, margins, and competition. |
How To Interpret Your Ad Spend
Case 1: Ad spend is rising, but sales aren't.
That's a red flag- your ads may be driving the wrong traffic, or your listings aren't converting. Before adjusting bids across the board, it's worth running a structured wasted ad spend audit to find exactly where that spend is leaking.
Case 2: Ad spend is stable, but sales are increasing.
That's a good sign- you're becoming more efficient. What to do to make the most of it:
Scale campaigns that are delivering strong returns
Consider testing new keywords or ASIN targets to grow further
Use campaign budget rules to manage spending more dynamically
6. Cost-Per-Click (CPC)
Cost-Per-Click (CPC) is the average amount you're charged each time someone clicks on your ad. Amazon runs on an auction model, so you don't always pay your full bid- just enough to beat the next highest bidder.
Why Does CPC Matter?
CPC affects everything downstream- your ACoS, ROAS, and overall ad efficiency. A high CPC can eat into your margins fast, especially if your conversion rate isn't strong. Keeping CPC in check helps you stay profitable.
It's also a reflection of how competitive your keywords or targets are. Higher CPC often means more competition.
How Is Cost-Per-Click Calculated?
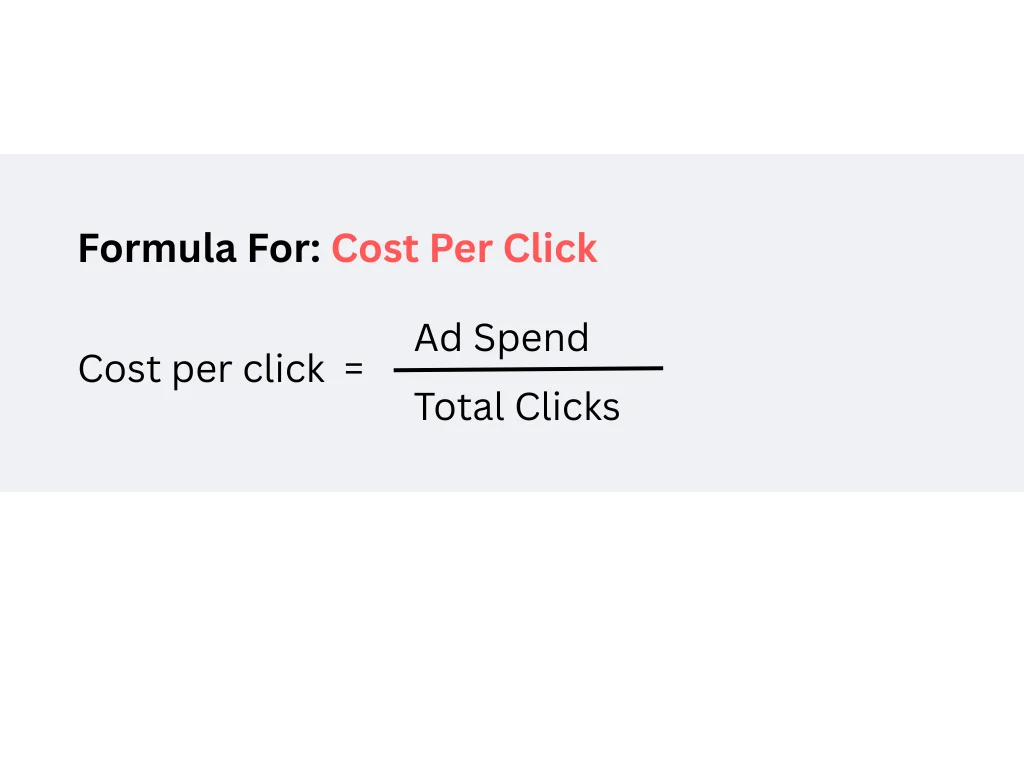
This is the general formula used to calculate cost-per-click for Amazon ads:
CPC = Total Ad Spend ÷ Total Clicks
Example: If you spent $75 on 100 clicks:
CPC = $75 ÷ 100 = $0.75
Unit for CPC | Dollars ($) |
Benchmark figure for CPC | $0.70 to $1.50 is typical for most categories. It can be much higher in competitive niches (like supplements or electronics). Always measure CPC against your profit margins. |
7. Advertising Cost of Sales (ACoS)
ACoS shows how much you spent on ads to generate each dollar of ad-attributed revenue. The formula is ACoS = (Ad Spend ÷ Ad-Attributed Sales) × 100. A lower ACoS means more efficient spend at the campaign level; a higher ACoS isn't automatically a problem, especially during a launch or a deliberate visibility push, but it does mean you're paying more per dollar of ad revenue.
We've covered the full formula walkthrough, common calculation mistakes, and optimization tactics in our guide to calculating and optimizing ACoS. If you're trying to work out what counts as "good" for your specific margins and category, that's covered in what's a good ACoS on Amazon.
8. Total Advertising Cost of Sales (TACoS)
TACoS measures ad spend against your total revenue- both ad-attributed and organic- rather than just the sales your ads can directly take credit for. The formula is TACoS = (Ad Spend ÷ Total Sales) × 100. Where ACoS tells you how a single campaign is performing in isolation, TACoS tells you whether your advertising is actually building organic momentum over time. A TACoS that's falling while sales hold steady or grow is usually a good sign that paid traffic is feeding stronger organic rank.
We've laid out the full TACoS formula and a strategy for bringing it down over time in our TACoS guide, and compared the two metrics head-to-head in ACoS vs TACoS.
9. Return on Ad Spend (ROAS)
ROAS flips the ACoS equation around: instead of showing cost as a percentage of revenue, it shows revenue as a multiple of spend. The formula is ROAS = Ad-Attributed Sales ÷ Ad Spend. A ROAS of 4.0 means every $1 spent on ads returned $4 in ad-attributed sales. It's especially useful for comparing campaigns with different budgets, since it normalizes performance regardless of scale.
The catch is that standard ROAS only counts what Amazon charges you for ads. It doesn't include software, agency or freelancer fees, or the time your team spends managing campaigns- that's where Real ROAS comes in, covered next.
10. Real Return on Ad Spend (Real ROAS)
Real ROAS takes the standard ROAS formula a step further. Instead of just using Amazon ad spend, it includes all advertising-related costs- like software tools, agency or freelancer fees, creative costs, and internal labor. It's the most honest look at what you're actually earning from your ad investment.
Why Does Real ROAS Matter?
Standard ROAS can make your campaigns look great- until you factor in the rest of what you're spending to run them. Real ROAS gives you a clearer view of profitability by including everything tied to your advertising strategy.
It's especially useful for brands working with agencies, using PPC automation tools, or dedicating significant team time to ad management. If your ROAS looks solid on paper but you're still losing money, this is the metric you need to check.
How Is Real ROAS Calculated?
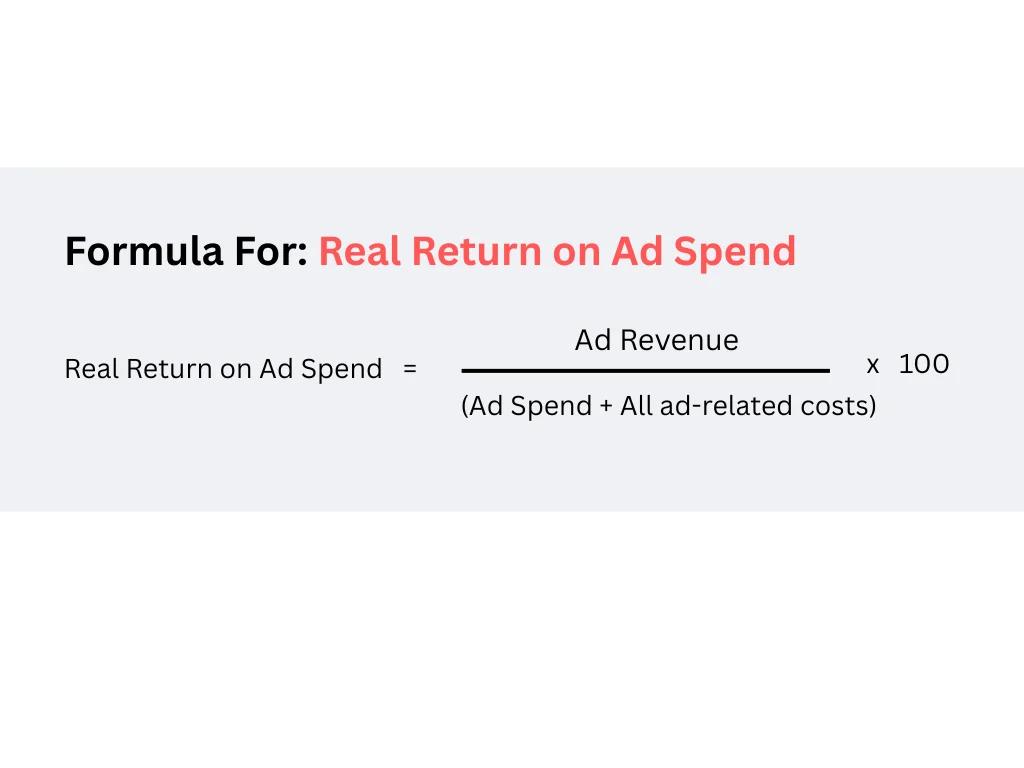
Here's the formula you can use to calculate your Real ROAS from Amazon Ads. Since Amazon can't do these calculations for you, you must calculate your Real ROAS yourself.
Real ROAS = Ad Revenue ÷ (Ad Spend + Ad-Related Overhead)
Example: Let's say you had:
Ad spend = $1,000
PPC tool subscription = $200
Freelance ad manager = $300
Total ad cost = $1,500
Ad-attributed sales = $6,000
Then, your Real ROAS would be: $6,000 ÷ $1,500 = 4.0
Unit for Real ROAS | Multiplier (x times in return) |
Benchmark figure for Real ROAS | There's no fixed benchmark- aim for at least 3x to stay profitable after full ad costs. Real ROAS will always be lower than regular ROAS, and that's the point. |
How To Interpret Real ROAS
Case 1: Real ROAS is lower than expected, even though regular ROAS is solid
This means you're likely overspending on tools, services, or inefficient team processes. What to do:
Audit your PPC stack (software, agency, freelancer costs)
Improve in-house efficiency- fewer hours, better automation
Prioritize high-margin products where extra overhead is justifiable
Case 2: Real ROAS is healthy (3x or above)
If your Real ROAS is higher than 3, you're doing pretty well with Amazon Ads. If you can maintain this figure consistently over a couple of weeks, consider scaling your PPC efforts with confidence.
Which Metrics Matter Most
While all 10 PPC metrics have value, a few tend to carry more weight when it comes to actual decision-making and profitability.
The ones that matter most are:
Conversion Rate (CVR): Because it tells you if your product and listing are doing their job. High impressions and clicks mean nothing if no one buys. CVR directly reflects listing quality and the strength of your offer.
ACoS: The go-to metric for evaluating campaign-level cost efficiency- it tells you how much you're spending to earn a dollar of ad revenue. For the full formula and what counts as "good" for your margins, see our guides on calculating and optimizing ACoS and what's a good ACoS.
TACoS: Unlike ACoS, TACoS accounts for organic sales too, making it a better indicator of long-term brand growth and how ads are supporting overall sales momentum. We go deeper on the formula and strategy in our TACoS guide, and compare the two directly in ACoS vs TACoS.
Real ROAS: Standard ROAS looks good on a dashboard, but Real ROAS tells you if you're truly profitable after software, agency, freelancer, and team costs. It's the most honest measure of ad performance for brands with real overhead.
These metrics don't just show performance: they inform action. They help you make trade-offs, allocate budget, and decide when to scale, cut, or optimize.
Where Can You Find These Metrics on Amazon
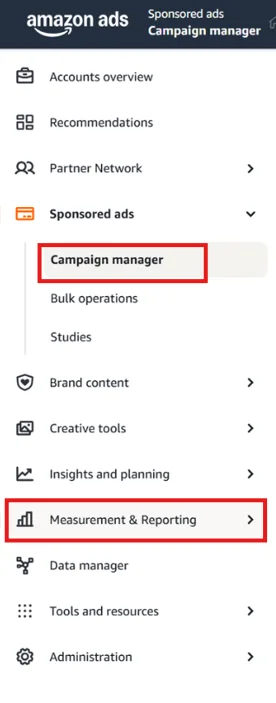
Most of the key Amazon PPC metrics are accessible in the campaign manager of the Amazon Ads Console. You can also find this data inside the "measurement and reporting" tab in the Ads Console.
Here, you'll be able to find data on metrics like:
Impressions
Clicks
Click-Through Rate (CTR)
Cost-Per-Click (CPC)
Ad Spend
ROAS
ACoS
Metrics like TACoS and Real ROAS require data from sources outside of the Ads Console, which is why you'll need to calculate them manually. For TACoS, you'll need total sales (organic + paid) from Amazon Seller Central.
For Real ROAS, you'll need to add up expenses like any tools you're using for Amazon PPC, any freelancers or agency fees you've paid, and any other overhead going into PPC, then weigh that against your ad-attributed sales.
How Often Should You Check These Metrics?
Not all metrics need daily attention, but some absolutely do. How often you check each one depends on what it tells you and how fast it tends to change.
Metrics like impressions, clicks, ad spend, and CPC should be monitored daily or every other day- especially if you're running active campaigns with flexible budgets or aggressive goals. These change quickly and can reveal issues like budget caps, broken targeting, or overspending.
On the other hand, metrics like ACoS, TACoS, conversion rate, and ROAS are better evaluated weekly. These need a little more time to stabilize and give meaningful signals. Checking them too often can lead to overreactions based on short-term noise.
Real ROAS? That one's more of a monthly or quarterly check, since it involves overhead and broader business costs. It's less about daily performance and more about long-term profitability.
The key is to find a rhythm that matches your campaign size and goals- and to avoid micromanaging the numbers that need time to tell the full story.
Glossary Table For Key Amazon PPC Metrics
You now have a solid foundation in Amazon PPC analytics, and should be able to decide what to track, why to track it, and where to spot the metrics that need attention.
For quick reference, the table below summarizes the essential details for each of the 10 Amazon PPC metrics discussed above.
Metric | Description | Formula | Unit |
Impressions | The number of times your ad appears on a shopper's screen. | Automatically tracked | Count |
Clicks | The number of times shoppers click on your ad. | Automatically tracked | Count |
Click-Through Rate (CTR) | Percentage of impressions that result in clicks | (Clicks ÷ Impressions) × 100 | Percentage |
Conversion Rate (CVR or CR) | Percentage of clicks that result in conversions | (Orders ÷ Clicks) × 100 | Percentage |
Ad Spend | Total amount spent on clicks for your ads | Automatically tracked | Dollars |
Cost-Per-Click (CPC) | Average cost paid per click received | Ad Spend ÷ Total Clicks | Dollars |
Advertising Cost of Sales (ACoS) | How much ad spend it took to generate $1 in ad revenue | (Ad Spend ÷ Ad Revenue) × 100 | Percentage |
Total Advertising Cost of Sales (TACoS) | Ad spend as a percentage of total revenue (organic + paid) | (Ad Spend ÷ Total Revenue) × 100 | Percentage |
Return on Ad Spend (ROAS) | Revenue generated for each dollar spent on ads | Ad Revenue ÷ Ad Spend | Multiplier |
Real Return on Ad Spend (Real ROAS) | ROAS that accounts for all ad-related costs | Ad Revenue ÷ (Ad Spend + All Ad-Related Costs) | Multiplier |
Final Note
Amazon PPC isn't just about running ads- it's about understanding the why behind every result. These 10 metrics help you go beyond vanity numbers and surface the data that actually drives growth, efficiency, and profitability. Whether you're scaling aggressively or protecting margins, let your metrics lead the way. Smart decisions start with smart tracking.
Frequently asked questions
ACoS looks at ad spend vs. ad-attributed revenue, while TACoS compares ad spend to total revenue, including organic sales.