 Bilal Siddiqui
Key takeaways
A sales decline is an outcome, not a diagnosis. Check sessions, unit session percentage, Featured Offer exposure, and inventory availability to identify the problem before changing your listing or advertising.
Start with account-level Business Reports, then investigate individual child ASINs. Parent-level totals can hide underperforming variations, and child ASIN reporting is not the same as seller SKU reporting.
Unit session percentage equals units ordered divided by sessions, multiplied by 100. It measures how visits translate into units, not profitability or advertising conversion, and can exceed 100% when shoppers buy multiple units.
Use each report for its intended purpose: Business Reports for retail performance, Brand Analytics for shopper search behavior, Amazon Ads for attributed advertising outcomes, Payments for settlements, and FBA reports for operations. Align dates, marketplace, definitions, and scope before comparing totals.
Best Sellers Rank provides category-level sales context, not exact unit sales or organic keyword position. Combine it with your own performance trends and use a consistent reporting routine to test hypotheses before taking action.
Sales are down eighteen percent this week. That number, by itself, tells you almost nothing.
If sessions fell by roughly the same amount while conversion held steady, you have a traffic problem. If sessions stayed flat but fewer visits became orders, the issue sits in the offer or the detail page. If both look normal but Featured Offer exposure dropped, the offer needs investigation before anyone touches the listing copy. Three different causes, one identical headline number.
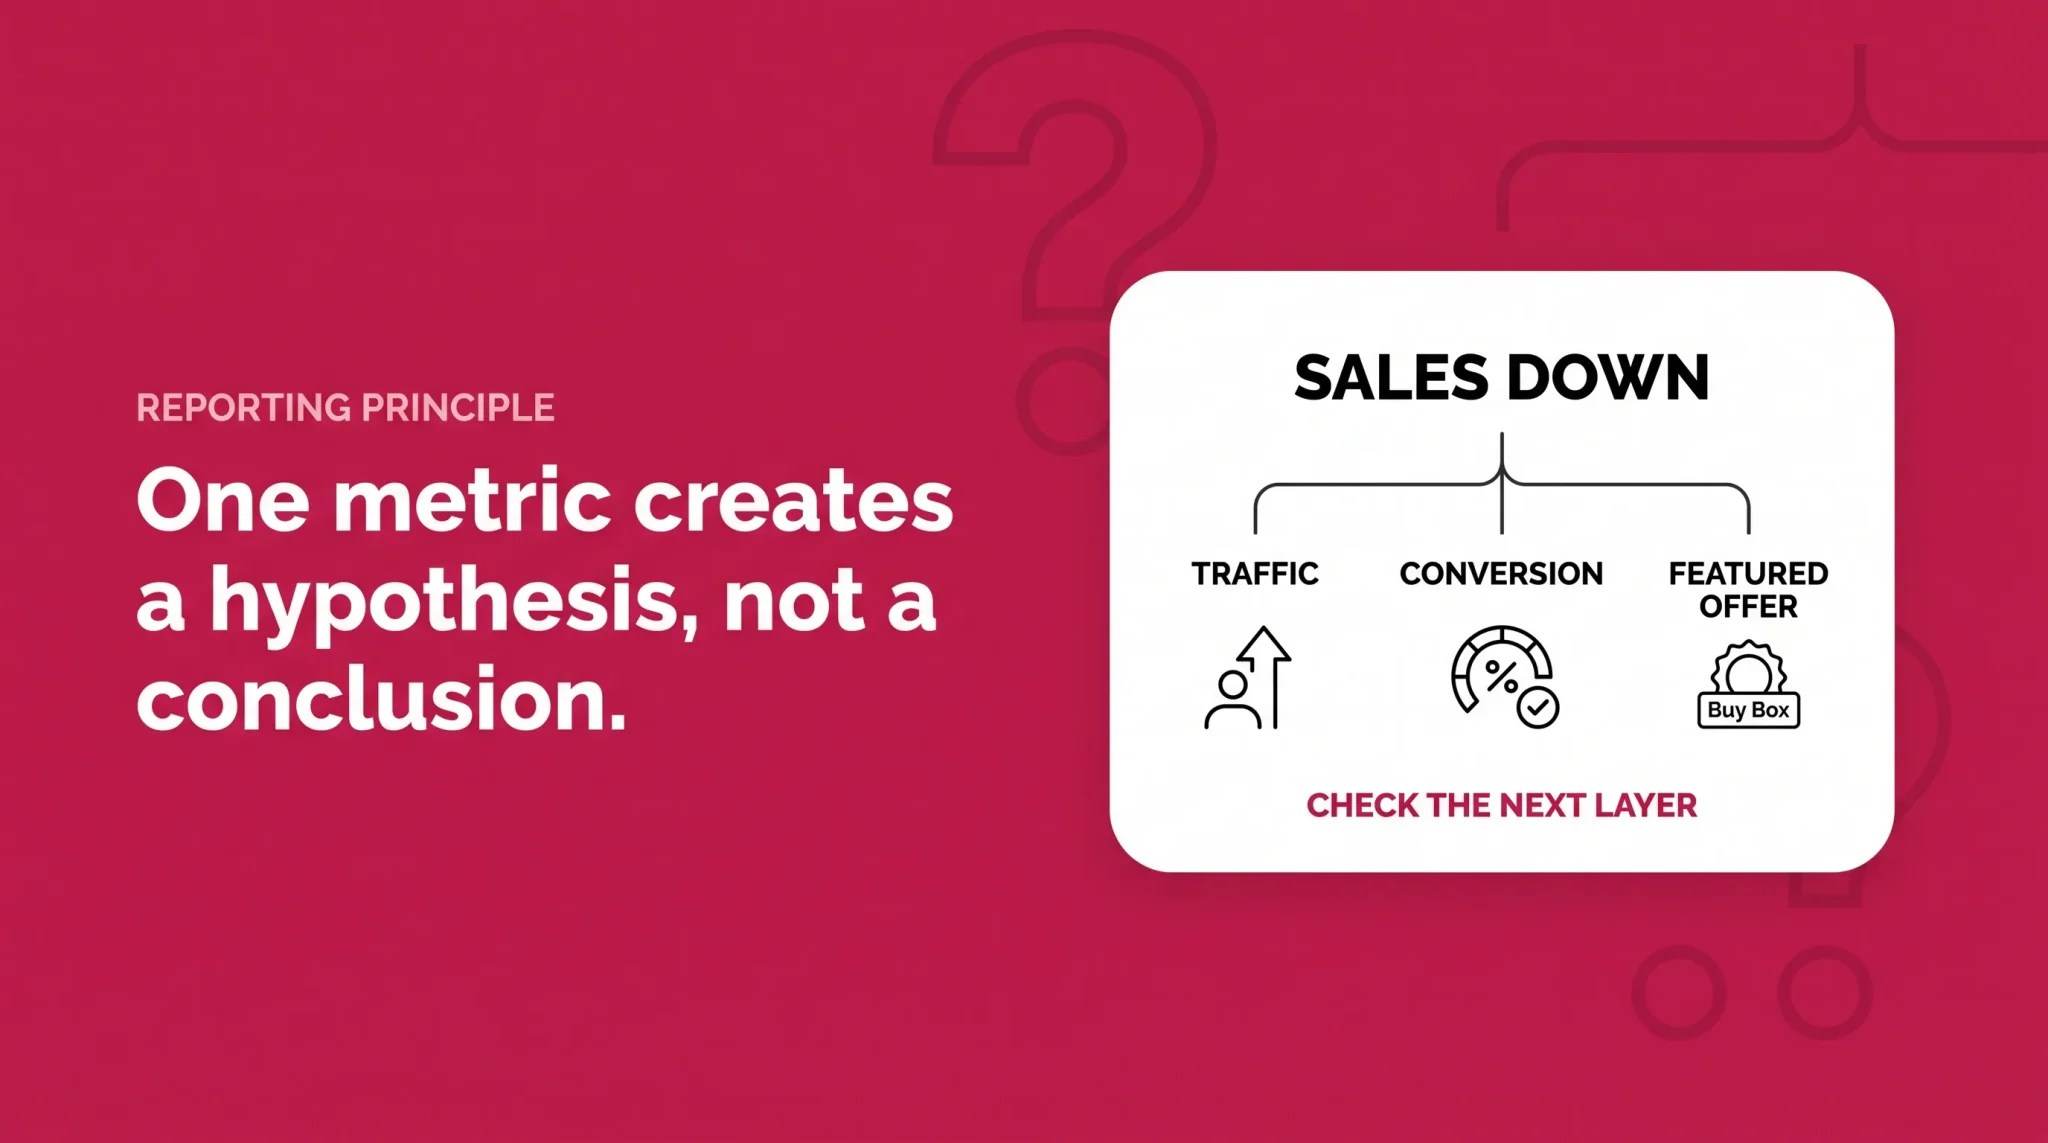
That is what Amazon Business Reports are for. They are not a dashboard you admire on Monday morning. They are the instruments you use to work out which layer of the business moved, so the fix you choose matches the problem you have. This guide covers the core Seller Central reports and seller metrics, how to read them in sequence, where advertising reports and Best Sellers Rank fit, and why two Amazon reports can show different sales totals without either being wrong.
Start With the Business Question, Not the Report
Most reporting guides list every report Amazon offers and leave you to work out which one matters. That is backwards. Sellers rarely wonder what reports exist. They wonder why the number changed.
Working from the question keeps you out of data that cannot answer it. A drop in ordered product sales is an outcome, not a diagnosis. Beneath it sit distinct layers, each with its own report. Traffic is measured by sessions and page views. Conversion is measured by unit session percentage. Offer competitiveness is measured by Featured Offer exposure and availability. Paid contribution sits in Amazon Ads reporting. Shopper demand sits in Brand Analytics, if your brand is eligible.
Move through those layers in order and you narrow the field at every step. Skip ahead and you end up rewriting bullet points because sales dropped, when the real cause was a competing offer that undercut you for six days.
One principle holds all of this together: a single metric produces a hypothesis, not a conclusion.
Seller question | First report or metric | Supporting check | Common mistake |
|---|---|---|---|
Did total sales change? | Business Reports, Sales and Traffic by Date | Compare the same weekday range in the prior period | Reading the Payments balance as a sales figure |
Which product changed? | Business Reports, By Child ASIN | Roll up to parent to see if it is isolated | Assuming an account wide problem from one bad ASIN |
Did traffic change? | Sessions and page views | Advertising delivery, availability, seasonality | Concluding search rankings collapsed with no rank data |
Did conversion change? | Unit session percentage | Featured Offer exposure, price, child mix | Rewriting listing copy before checking the offer |
Did offer exposure change? | Featured Offer Percentage | Price, availability, fulfillment, competing offers | Assuming price is always the reason |
Is the change coming from advertising? | Amazon Ads campaign and advertised product reporting | Ad attributed sales against the total sales trend | Expecting ad sales and Business Reports sales to match |
Did shopper demand change? | Brand Analytics, Search Query Performance | Category seasonality | Looking for organic search queries in Business Reports |
Why does cash not match sales? | Payments reports | Refunds, fees, disbursement timing | Treating ordered product sales as money received |
Did category position change? | Best Sellers Rank | Your own sales trend for the same period | Reading BSR as a unit estimate |
Sales and Traffic: The Account Level Starting Point
Business Reports live in Seller Central under Reports, then Business Reports. Amazon currently presents them in two main views. By Date aggregates performance across your catalog for a selected period. By ASIN breaks the same performance down to individual products, at parent or child level.
Start with By Date. It answers one question well: did total performance actually change, or does it only feel that way? You are reading ordered product sales, units ordered, sessions, page views, and unit session percentage across the whole catalog.
Two habits make this view more reliable. Compare like periods, because a Tuesday to Monday range against a Wednesday to Tuesday range produces a difference that means nothing. And give recent dates room. Business Reports provide Seller Central sales and traffic data that Amazon refreshes over time, and figures for very recent dates can still change as Amazon processes activity. A same day panic is often a processing artifact rather than a business event.
Once you know the direction, the next question is whether the change is broad or concentrated. That is a By ASIN question.
Parent and Child ASIN Reporting
Three identifiers get confused here, and the old advice about SKU level reporting is the reason.
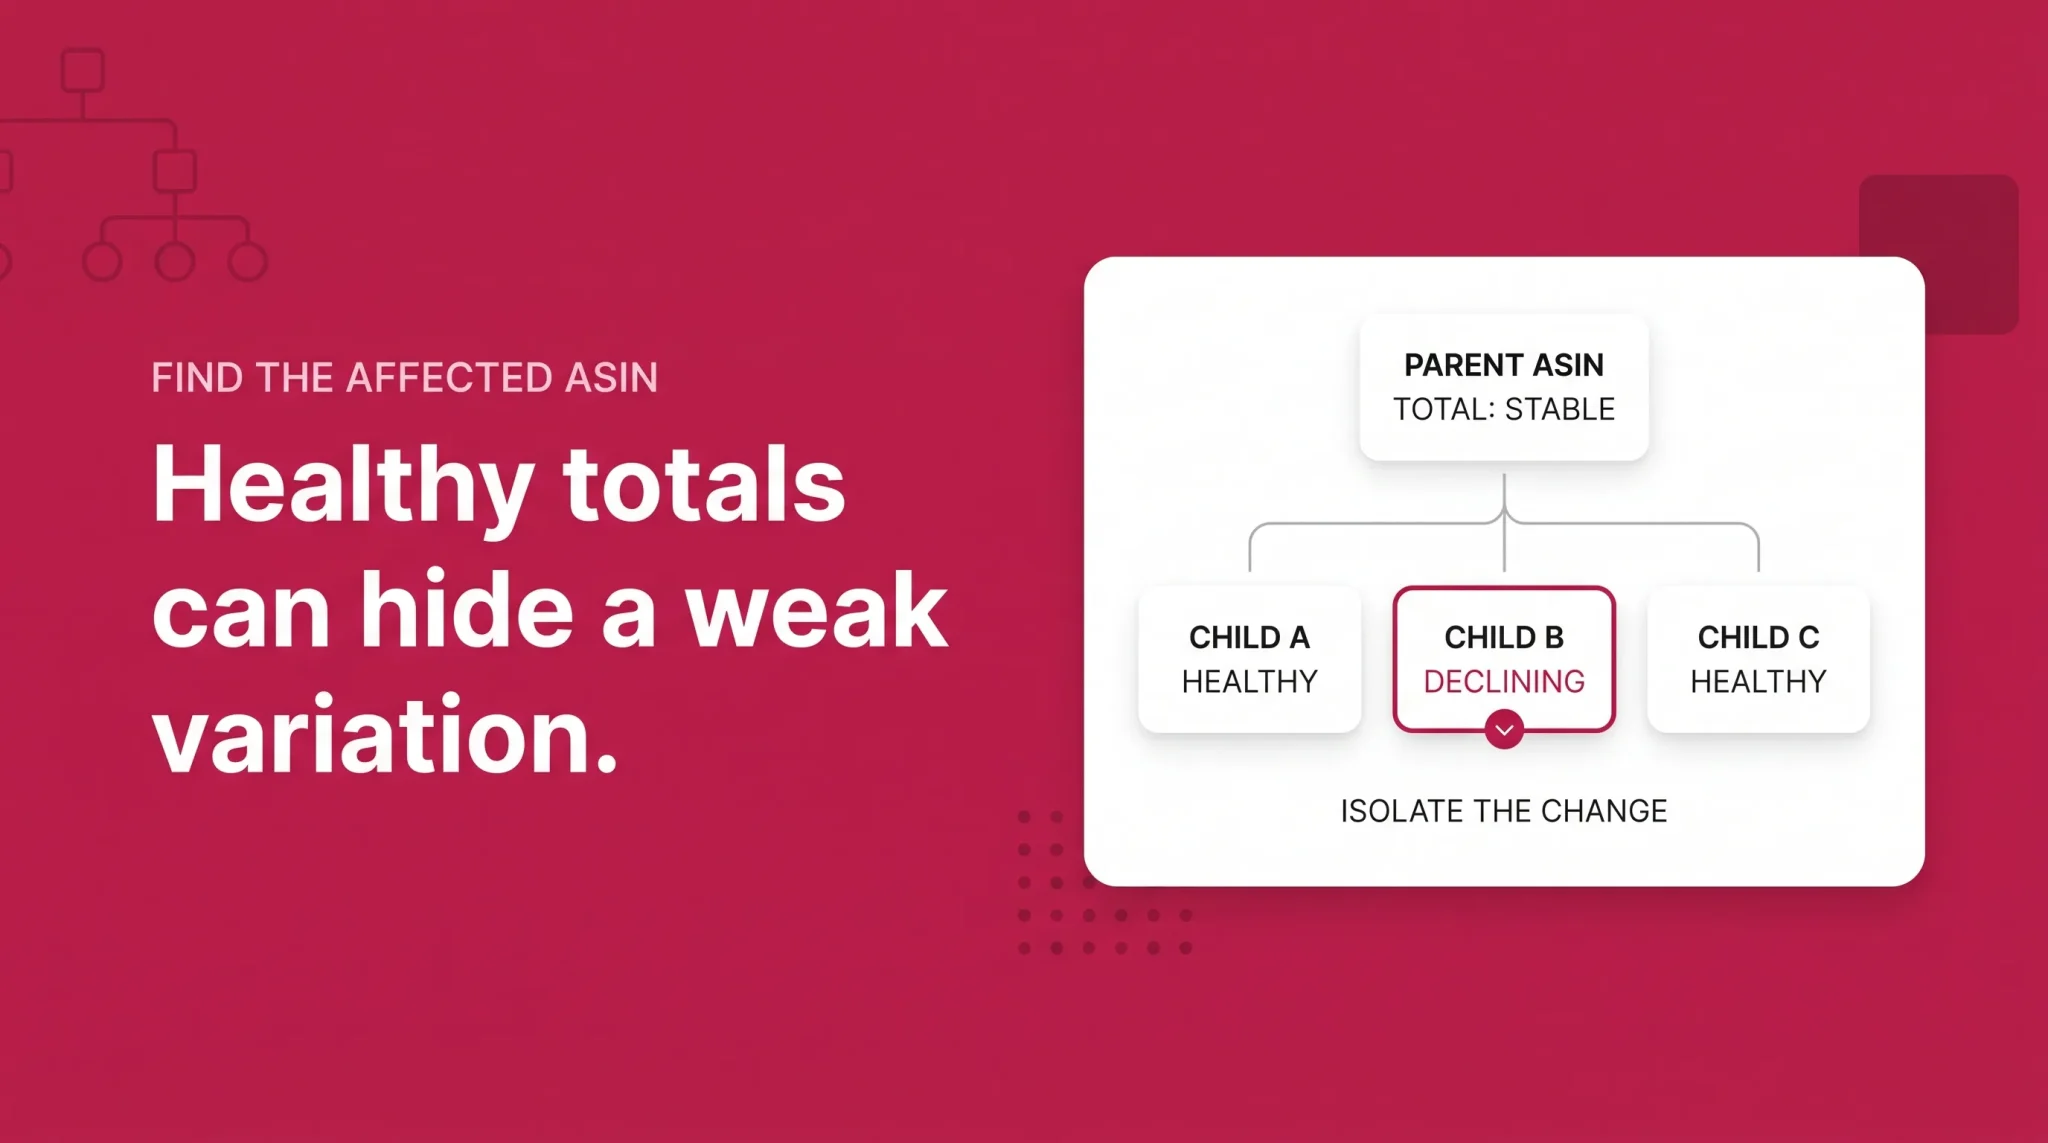
A parent ASIN is a catalog relationship, not a buyable product. It groups variations such as sizes, colors, or counts. A child ASIN is a buyable variation, the thing a shopper adds to the cart. A seller SKU is your own offer identifier. These are not interchangeable, and the By Child ASIN report is not a SKU level report.
The diagnostic value comes from the gap between levels. A parent can look healthy while one child quietly loses sessions, loses Featured Offer exposure, converts worse than last month, changes price, or goes unavailable. Aggregate reporting hides that, because the healthy children absorb the damage in the total.
So when the account level trend moves, open By Child ASIN and sort by the metric that moved. The decline is rarely evenly spread. It usually sits in two or three children, and once you know which, every later check gets more specific.
Sessions Versus Page Views
These two get treated as synonyms constantly, and they measure different things.
Sessions represent visits to your product pages, grouped under Amazon's session logic. Current Amazon seller guidance describes sessions as visits within a twenty four hour period, so one shopper returning three times in an afternoon generally registers as one session. Page views count the views themselves, which means a single session can contain several page views.
A page view is not an advertising impression. An impression means an ad was served. A page view means somebody was already on your detail page. Sessions are the number to trust for demand, because that is the denominator Amazon uses for conversion.
Units Ordered, Total Order Items, and Ordered Product Sales
Three sales metrics that sound similar and are not.
Units ordered counts individual units customers ordered. Total order items counts order items, a different unit of measurement, and the two figures often disagree because a single order item can involve more than one unit. Treat them as related but distinct counts rather than deriving one from the other.
Ordered product sales is the sales value of products ordered within the report's scope and date range. It is not cash deposited, not your settlement total, not profit, and not advertising attributed sales.
The useful pairing is units ordered against ordered product sales. When units hold steady but sales value falls, the volume of your business did not change. The realized price did. That points toward discounts, coupons, promotions, or a shift in which children are selling, rather than a demand problem.
Unit Session Percentage
Unit session percentage is Amazon's conversion oriented metric for the product detail page, and it is the most diagnostic number in Business Reports.
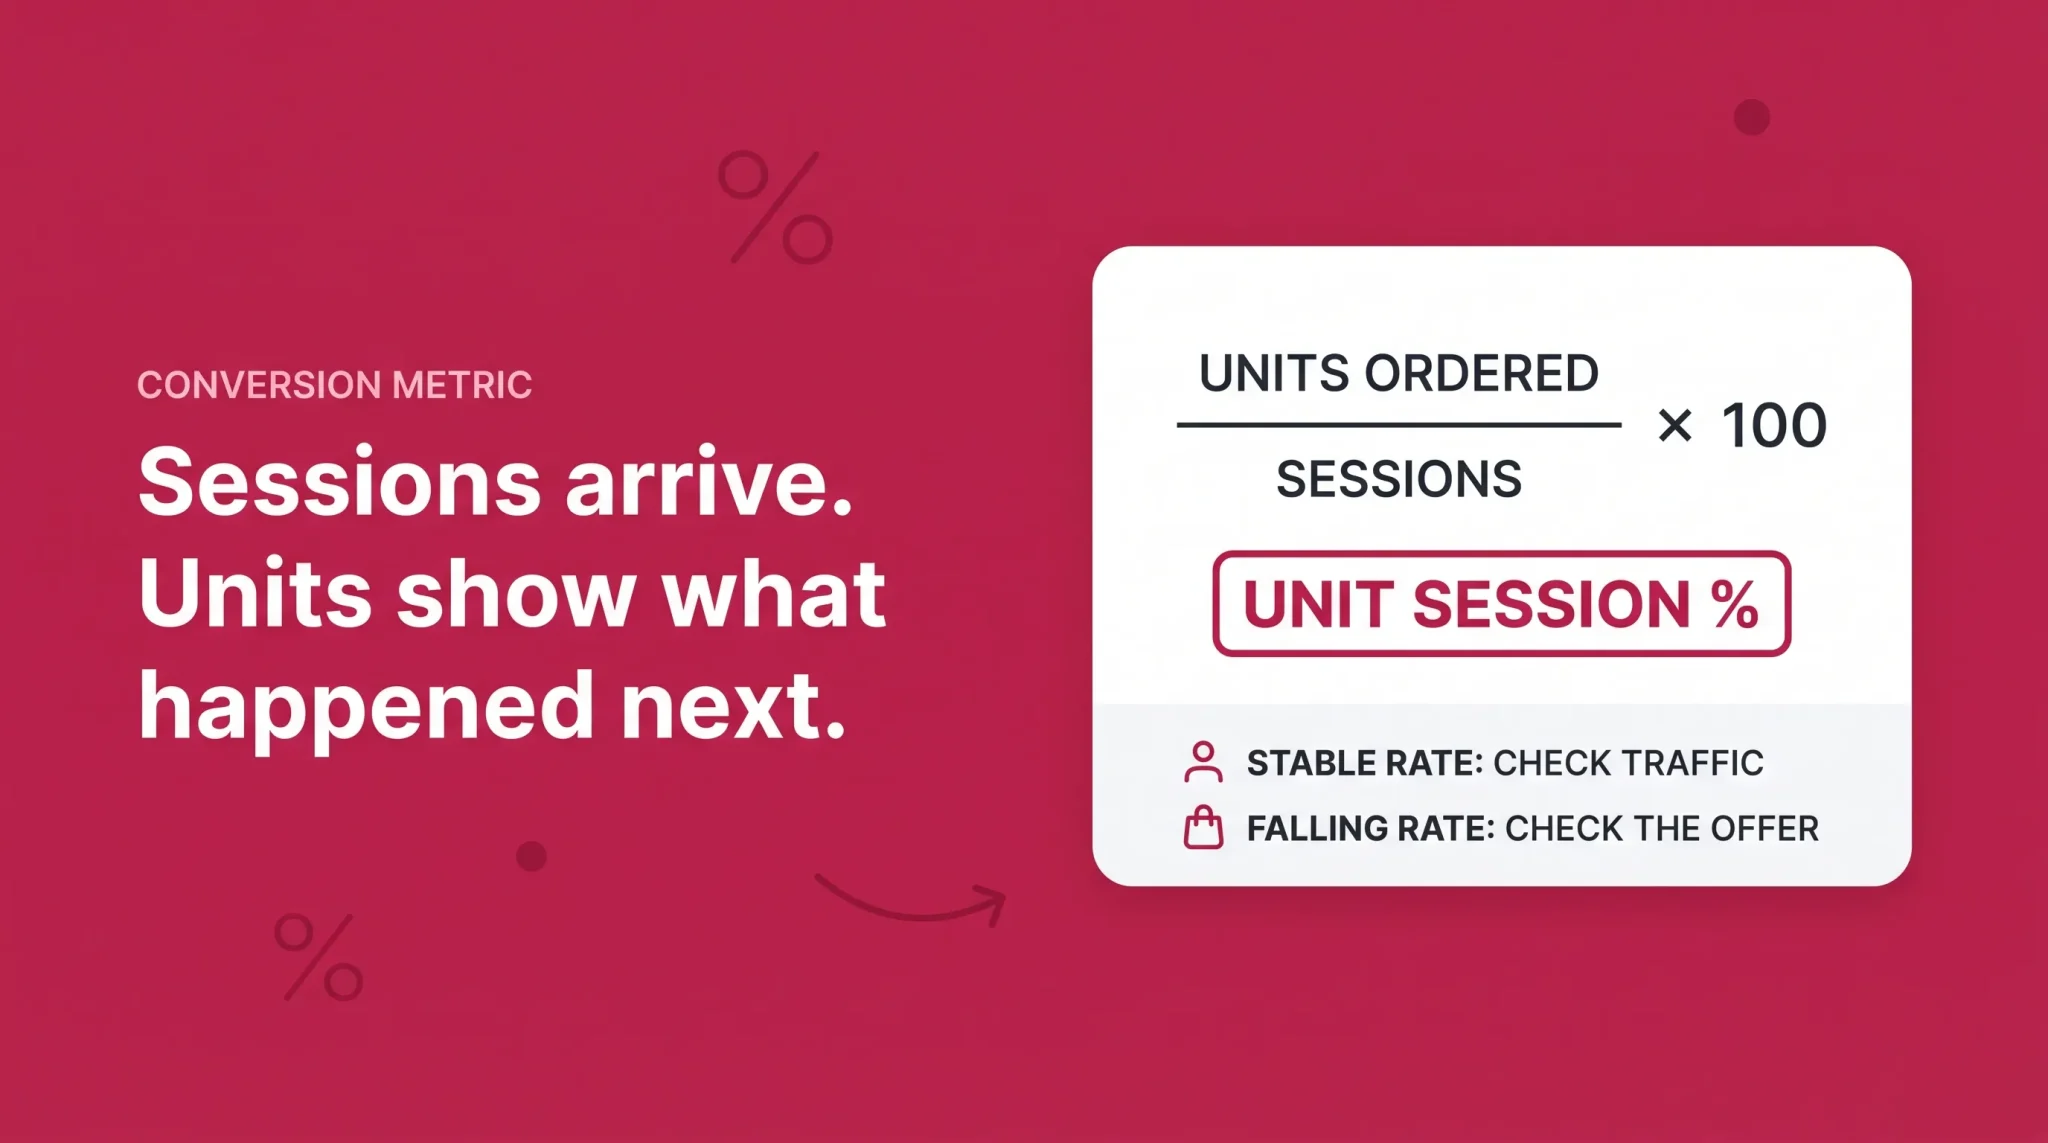
Unit Session Percentage = Units Ordered ÷ Sessions × 100
Read it as what happens after a shopper arrives. Sessions tell you how many people reached the page. Unit session percentage tells you how efficiently those visits produced units. When sales fall and this number is stable, the page is doing its job and fewer people are reaching it. When sales fall and this number drops, something changed at or around the offer.
Three things it is not. It is not a profit rate, since a product can convert well and still lose money after fees and advertising. It is not an advertising conversion rate, which is calculated inside Amazon Ads against ad interactions. And it is not a universal ecommerce conversion rate comparable to benchmarks from other channels.
Because units sit in the numerator rather than orders, the metric can exceed one hundred percent when shoppers buy multiple units in a visit. That is normal for consumables and multipacks, and one reason a generic target percentage is close to useless.
Featured Offer Percentage
Featured Offer Percentage measures how often your offer held the featured position on the detail page relative to the page views your listing received. If shoppers reach your page but a competing offer holds that position, your traffic is converting for somebody else.
Featured Offer is Amazon's current product terminology, but some Business Reports views, exports, marketplaces, and even Amazon authored seller guidance still display the legacy label Buy Box Percentage. The metric is the same idea under either name.
When it declines, resist the reflex to blame price. Availability, fulfillment method and delivery promise, competing offers on the listing, and offer or account level eligibility can all reduce exposure. Investigate the offer layer before deciding anything about listing content.
Metric | What it measures | Best use | What it does not tell you |
|---|---|---|---|
Sessions | Visits to your product pages | Detecting traffic changes | Where the traffic came from |
Page Views | Total product page views | Comparing browsing depth | How many distinct shoppers visited |
Units Ordered | Units customers ordered | Volume trend by product | Revenue or margin |
Unit Session Percentage | Units ordered divided by sessions | Diagnosing conversion changes | Whether the sale was profitable |
Featured Offer Percentage | Share of page views your offer was featured | Spotting offer competitiveness problems | Why exposure was lost |
Ordered Product Sales | Sales value of ordered products in scope | Revenue trend and mix shifts | Cash received or profit earned |
Best Sellers Rank | Category relative sales position | Market context around your own trend | Unit volume or keyword position |
Product Performance Spotlight and ASIN Benchmarking
Amazon has layered an ASIN level analytics experience on top of the child ASIN workflow. Product Performance Spotlight is reached from Reports, then Business Reports, then the By Child ASIN report, by clicking into an individual child ASIN.
Amazon describes it as a centralized view of more than thirty ASIN level metrics spanning sales, traffic, inventory, pricing, cost, and promotional data, with custom alerts you configure, proactive alerts that flag meaningful changes, and comparison against similar products. Availability varies by account and marketplace, so treat it as an enhancement rather than a dependency. Promotional language describing this panel is not a statement that all Business Reports data is real time.
ASIN Benchmarking sits inside that same experience and is available to sellers on a Professional selling plan. It compares one of your ASINs against similar ASINs, with similarity determined using factors including category and price range, and the data is updated daily. Amazon currently exposes percentile comparisons including P25, the median at P50, P75, and the top ten performing similar ASINs, across average selling price, ordered product sales, page views, sessions, total order items, units ordered, and unit session percentage. Amazon's current help page describes availability as United States only, with historical data available from August 2024 in supported regions, so confirm the position for your marketplace in Seller Central.
Use it for one purpose: establishing whether your ASIN performs differently from comparable products on specific first party metrics. That answers what a generic benchmark cannot, which is whether a twelve percent conversion rate is strong for something like your product at something like your price. It does not reveal competitor identities, private sales data, account data, or advertising performance.
Diagnosing a Sales Drop From the Metrics
Here is the sequence in practice, with three short hypothetical situations.
Sales down and sessions down. Fewer people are reaching the page, so the first hypothesis is traffic or availability, not content. Check sessions and page views over a matched period, identify the affected parent and child ASINs, confirm inventory availability, look at Featured Offer Percentage, and check whether advertising delivery changed materially. Do not conclude that search rankings collapsed, because Business Reports contain no ranking data to support it.
Sales down, sessions stable, unit session percentage down. Traffic arrived and converted worse than it used to, so the first hypothesis is the offer or its competitiveness. Investigate price, Featured Offer exposure, delivery promise, recent reviews and ratings, any listing changes made in the window, the mix of children selling, and whether traffic shifted toward lower intent sources. Do not automatically rewrite the listing, because listing content is the one variable that probably did not change on its own.
Sessions rise but units ordered stay flat. More traffic, less efficiency. That can mean broader or weaker intent traffic, paid traffic expanding into looser targeting, a price change, a decline in Featured Offer exposure, or a shift in variation mix. Extra traffic is not automatically good.
Units stable but ordered product sales down. Volume held and value fell. Look at selling price, active discounts and coupons, promotional periods, and which child ASINs carried the volume, using only metrics present in the view you are reading.
Featured Offer Percentage down. Work the offer layer before assuming anything about traffic. Exposure loss drags sales down even when demand and page quality are unchanged.
Each of these is a hypothesis with a next check attached. None is a causal guarantee.
Business Reports Versus Brand Analytics
Business Reports answer questions about your own products: how much they sold, how many sessions and page views they received, how efficiently sessions converted into units, which parent or child ASIN changed, and how much Featured Offer exposure the offer held.
Brand Analytics answers questions about shoppers and search: what shoppers searched for, how queries performed through Search Query Performance, search funnel behavior, click share, cart add share, purchase share, market basket relationships, and repeat purchase behavior where available.
The boundary is simple. Business Reports can tell you sessions fell. They cannot tell you which shopper queries stopped producing them. That is a Brand Analytics question, covered in the Amazon Brand Analytics guide.
Business Reports Versus Amazon Ads Reporting
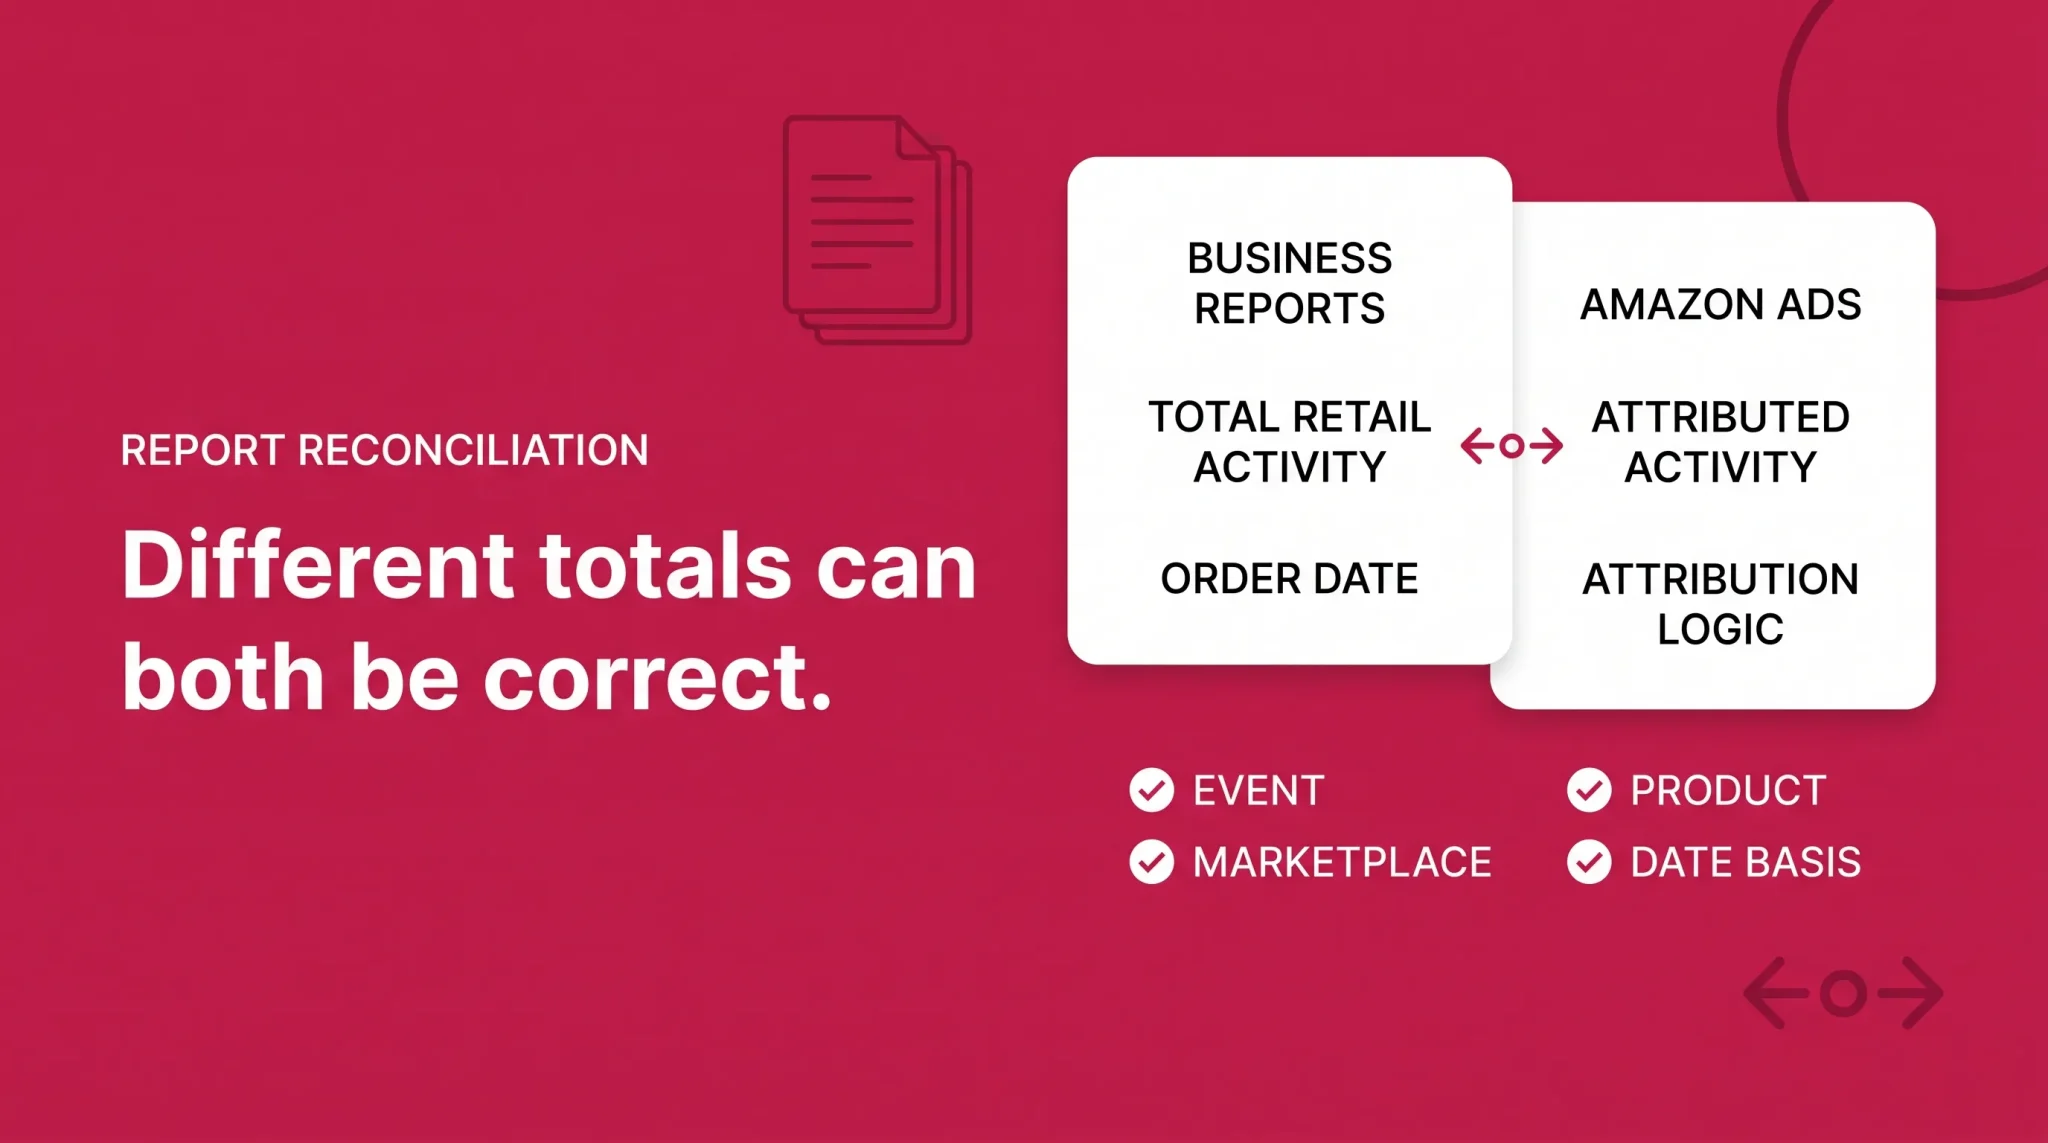
Advertising reporting lives in the Amazon Ads console under Measurement and Reporting, then Reporting. Unified reporting became generally available on June 8, 2026, consolidating reporting across accounts, ad products, countries, metrics, and dimensions in a single report. Amazon Ads is currently transitioning advertisers toward unified reporting, and Amazon has said it plans to sunset the legacy Sponsored Ads reports and Amazon DSP reports pages by December 31, 2026, so some legacy workflows may still be available during the migration. Migration state can differ between accounts.
For diagnosis you do not need the full catalog, only which report answers which question.
The campaign report tells you whether spend, delivery, and attributed outcomes moved at campaign level, which is where you start when the question is simply whether advertising changed. The advertised product report attributes those outcomes to specific ASINs, which is what you want when one child ASIN is the problem. The search term report shows which shopper queries produced ad interactions and attributed outcomes, and it does not show the organic queries behind your total sessions. The targeting report separates performance by the keywords and products you chose to target, the placement report shows where ads served, and the purchased product report shows what shoppers bought after interacting with an ad, which is not always the advertised product.
For each, ask only what question it answers, when to open it, and what it does not prove. Bidding, negatives, budget allocation, placement decisions, and efficiency targets are execution work covered in the Amazon PPC metrics guide.
Why Advertising Sales and Business Reports Sales Do Not Match
Sellers compare these totals constantly and then open a support case. In most cases nothing is broken.
Business Reports measure total retail activity on your products within their defined scope. Amazon Ads reports measure outcomes attributed to advertising under Amazon's attribution rules. Those rules changed on January 1, 2026, when Amazon introduced a shopping signal enhanced last touch methodology for view based conversions, and unified reporting further standardizes metrics, dimensions, and attribution methodology across ad products. Attribution also assigns conversions using its own date logic, which does not necessarily align with the order date basis in Business Reports.
Amazon Ads reporting and Seller Central Business Reports do not measure sales using identical attribution rules, so the totals should not be expected to reconcile perfectly. Ad attributed sales are a subset of total sales measured a different way, not a competing version of the same number.
Best Sellers Rank and Where It Fits
Best Sellers Rank, usually shortened to BSR, is a category relative sales ranking shown on product detail pages. A lower number generally indicates stronger relative sales performance within that category.
Amazon calculates it using sales volume data, with both recent and all time sales contributing and recent sales weighted more heavily. Two things it does not use as direct inputs are page views and customer reviews, so a rank does not reflect product quality or shopper sentiment. A product can hold more than one BSR across categories, with a different number in each, and ranks differ between Amazon stores, so a United States rank and a United Kingdom rank are not comparable. Amazon currently describes this data as updated frequently rather than committing to an hourly schedule.
What BSR is useful for is context. It tells you whether your category position moved alongside your own sales trend, which helps separate a listing specific problem from a category wide seasonal shift. What it cannot do is estimate unit volume. There is no published conversion from rank to units, no universal threshold that makes a rank good, and no category benchmark worth publishing, because a rank of one thousand means completely different things in categories of different sizes. Ignore rank to sales calculators.
BSR is category context around your reporting, not a replacement for sessions, unit session percentage, or any diagnosis you would run in Business Reports.
BSR Versus Organic Keyword Rank
Best Sellers Rank is a product's relative sales position within a category. Organic keyword rank is where a product appears in search results for one specific shopper query. A product can hold a strong BSR while ranking poorly for an individual keyword, and it can rank well for one keyword while holding a modest category BSR.
Both relate to sales volume, which is why they often move together, but neither directly controls the other. Business Reports show you neither, so keyword position needs a tracking process that sits outside these reports.
Business Reports Versus Payments and FBA Reports
Payments reports answer financial questions: what was settled, transferred, withheld, refunded, charged, or adjusted. Business Reports answer commercial questions about sales and detail page activity. Ordered product sales, a bank deposit, a settlement total, taxable income, and profit are five different figures, and only the first appears in Business Reports.
FBA reports answer operational questions about inventory, fulfillment, returns, shipments, adjustments, and reimbursements. They are the right place to confirm an availability problem you suspected from Business Reports, not where you diagnose traffic, conversion, or Featured Offer exposure.
Why Amazon Reports Show Different Numbers
Before treating two Amazon figures as inconsistent, check whether they measure the same thing at all. In most mismatches, at least one of these differs.
Metric definitions differ between surfaces. Marketplace selection differs, and a report filtered to one store will never match a total across several. Date ranges differ, including the timezone the report uses. Attribution logic differs between advertising and retail reporting. The event date differs, since some reports are built on order date and others on the date of the interaction that produced the conversion. Scope differs between parent and child aggregation, and between selected products and the whole catalog. Advertising activity is a subset of total retail activity. Cancellations and returns land after the fact and change historical figures. Report refresh timing means recent dates are still moving. Settlement deductions sit between sales and cash. Business and consumer order segmentation can split figures in reports that expose it.
The working rule is one sentence. First confirm the reports measure the same event, for the same products, in the same marketplace, using the same date basis. Only after all four align does a remaining gap deserve to be called a discrepancy.
A Reporting Cadence You Can Sustain
Nobody needs every report every day, and pretending otherwise guarantees the routine gets abandoned by week three.
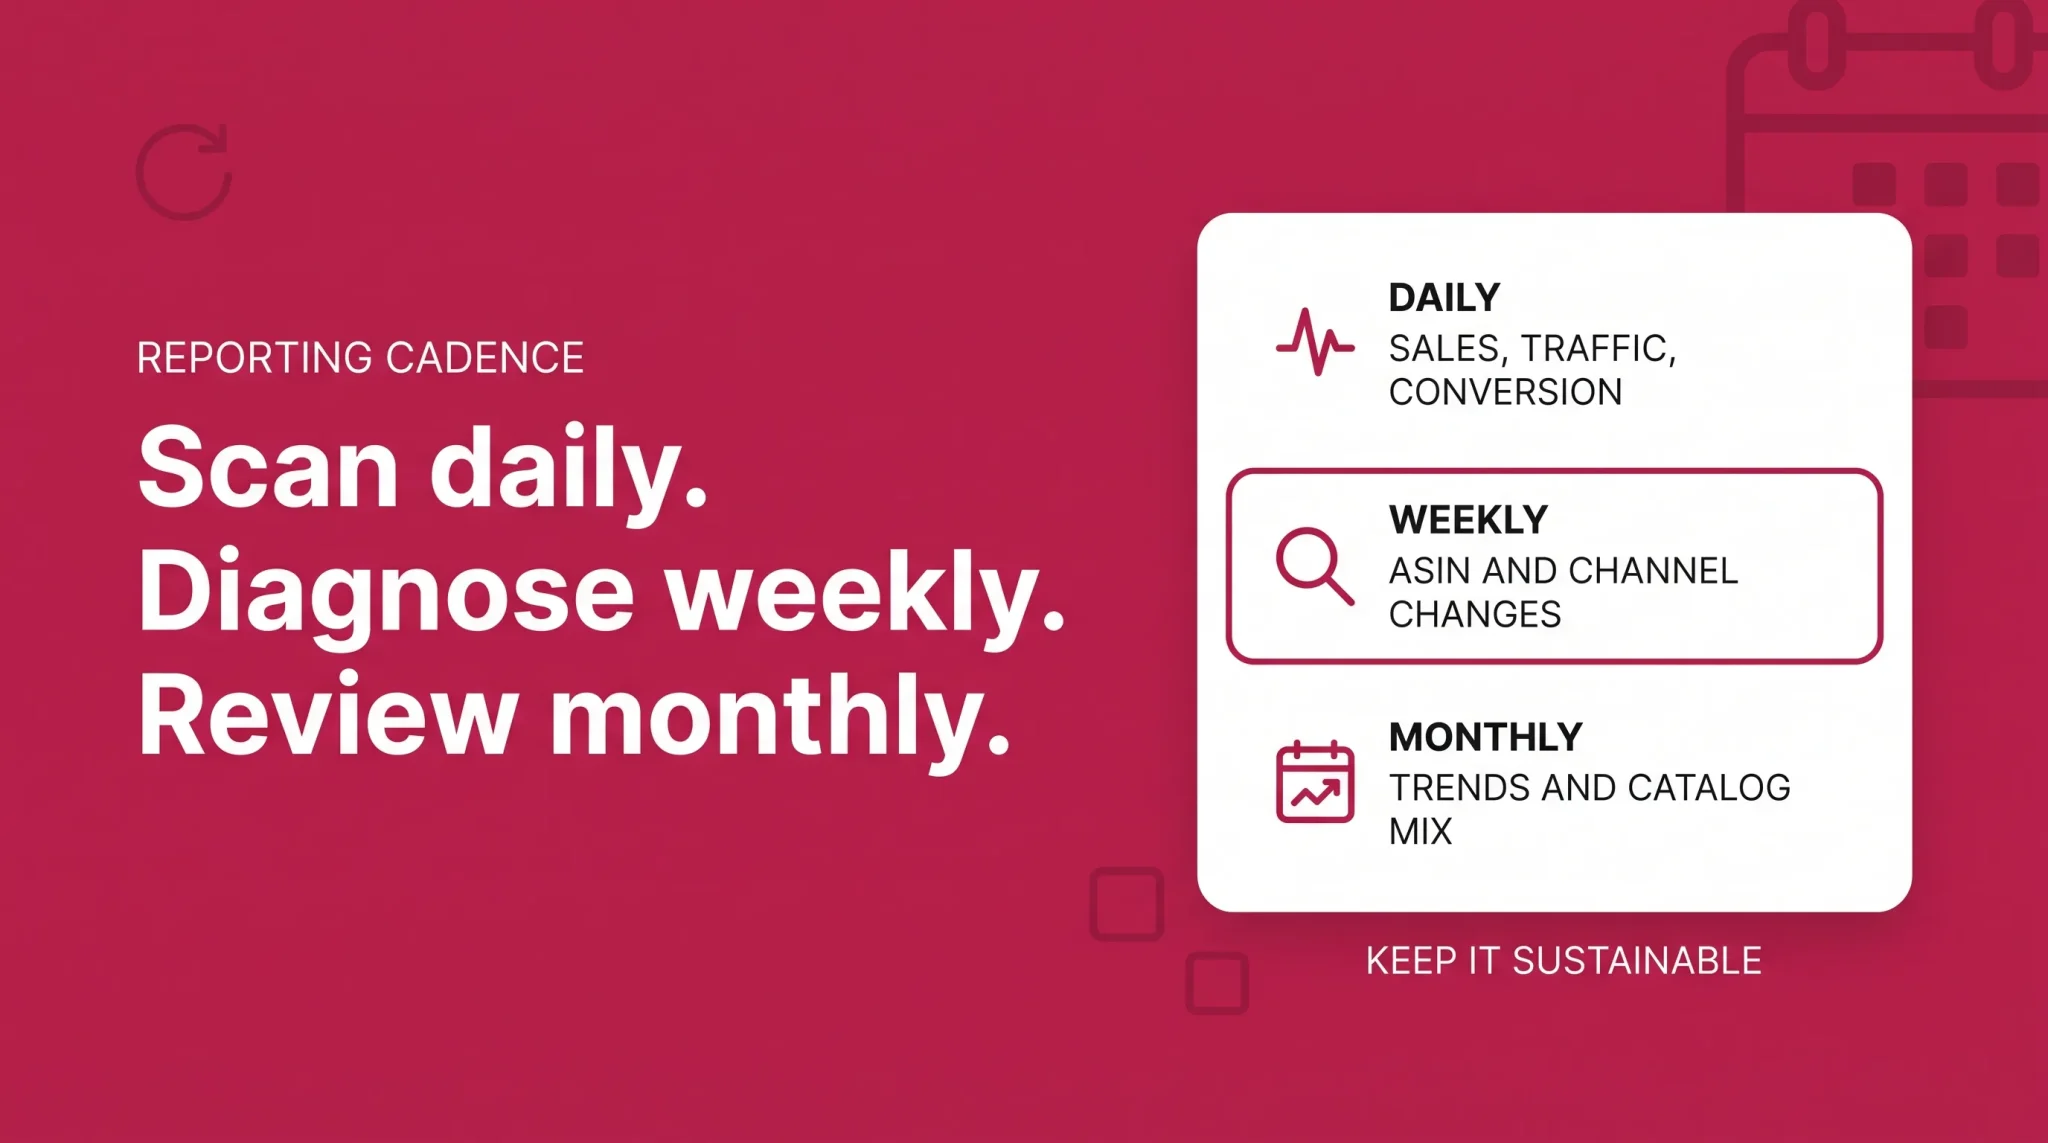
For high volume or actively changing accounts, a daily or several times weekly check covers ordered product sales, units ordered, sessions, unit session percentage, Featured Offer Percentage, and any material advertising anomaly. That is a five minute scan for direction, not an analysis session.
Weekly is where analysis belongs: ASIN level traffic changes, conversion trends, differences between parent and child performance, paid versus total performance, BSR trend, and any product behaving unlike the rest of the catalog. Monthly is for pattern work: longer term trends, seasonality, catalog mix, reconciliation across reports, ASIN benchmarking where available, and where growth is actually coming from.
Scale all of it to your situation. Sales velocity, catalog size, promotional calendar, seasonality, and business maturity change what is worth watching. A twelve ASIN account in a stable category does not need the cadence of a four hundred ASIN account running deals every month.
The Reporting Check Before You Change Anything
Run this before acting on any apparent performance change.
Marketplace confirmed and consistent across every report compared
Date range aligned, matched to the prior period, and long enough to be meaningful
Ordered product sales and units ordered trends both checked
Sessions and page views checked over the same range
Unit session percentage checked at account and ASIN level
Featured Offer Percentage checked
Affected parent and child ASINs isolated rather than assumed
Inventory availability confirmed for the affected period
Advertising reporting reviewed only when the paid channel is plausibly involved
Brand Analytics consulted only for search demand questions
BSR read as category context, never as a unit estimate
Payments used for any question about money received
Report scope aligned before treating two figures as contradictory
Findings documented before strategy or listing changes are made
Reporting tells you which metric moved. Deciding what to do about it is where most accounts lose time, usually by fixing the layer that was never broken. If you want a second set of eyes on your Seller Central reporting, Flairox can review your reports with you, isolate the ASINs and metrics that actually changed, separate traffic problems from conversion problems, cross check retail against advertising performance, and help build a reporting cadence your team will keep using. Schedule a call if that would help.
If the diagnosis points toward conversion execution, the Amazon conversion rate guide covers that work, and the Amazon growth strategy guide covers how to prioritize once you know where the problem sits.
Frequently asked questions
Business Reports are Seller Central reports covering your sales and detail page traffic. Find them under Reports, then Business Reports, with a By Date view for catalog level trends and a By ASIN view for individual products.